Population Pyramids
age cohorts
sex ratio
dependency ratio
pre/post reproductive
Factors for Population Growth
historical
social/cultural
economic
political
pro/anti natalist policies
migration
Growth Rate Measures
crude birthrate
crude death rate
total fertility rate
infant mortality rate
natural increase rate
doubling time
Population pyramids are amazing. I love them, and by the end of this course you’ll probably not love them haha, but you will understand how great they are as a tool for understanding countries. Population pyramids on their own is just data organized in a unique graph. The data includes males and females and their ages. That’s it. How many people are in a country, how many are males, how many are females, and their ages. From this data, we can draw conclusions about gender equality, economic development, job opportunities, and access to education, healthcare, and sanitation services.
Not only can you read a population pyramid like a secret language, but population pyramids can also be crystal balls that give insight into a country’s and the world’s future.

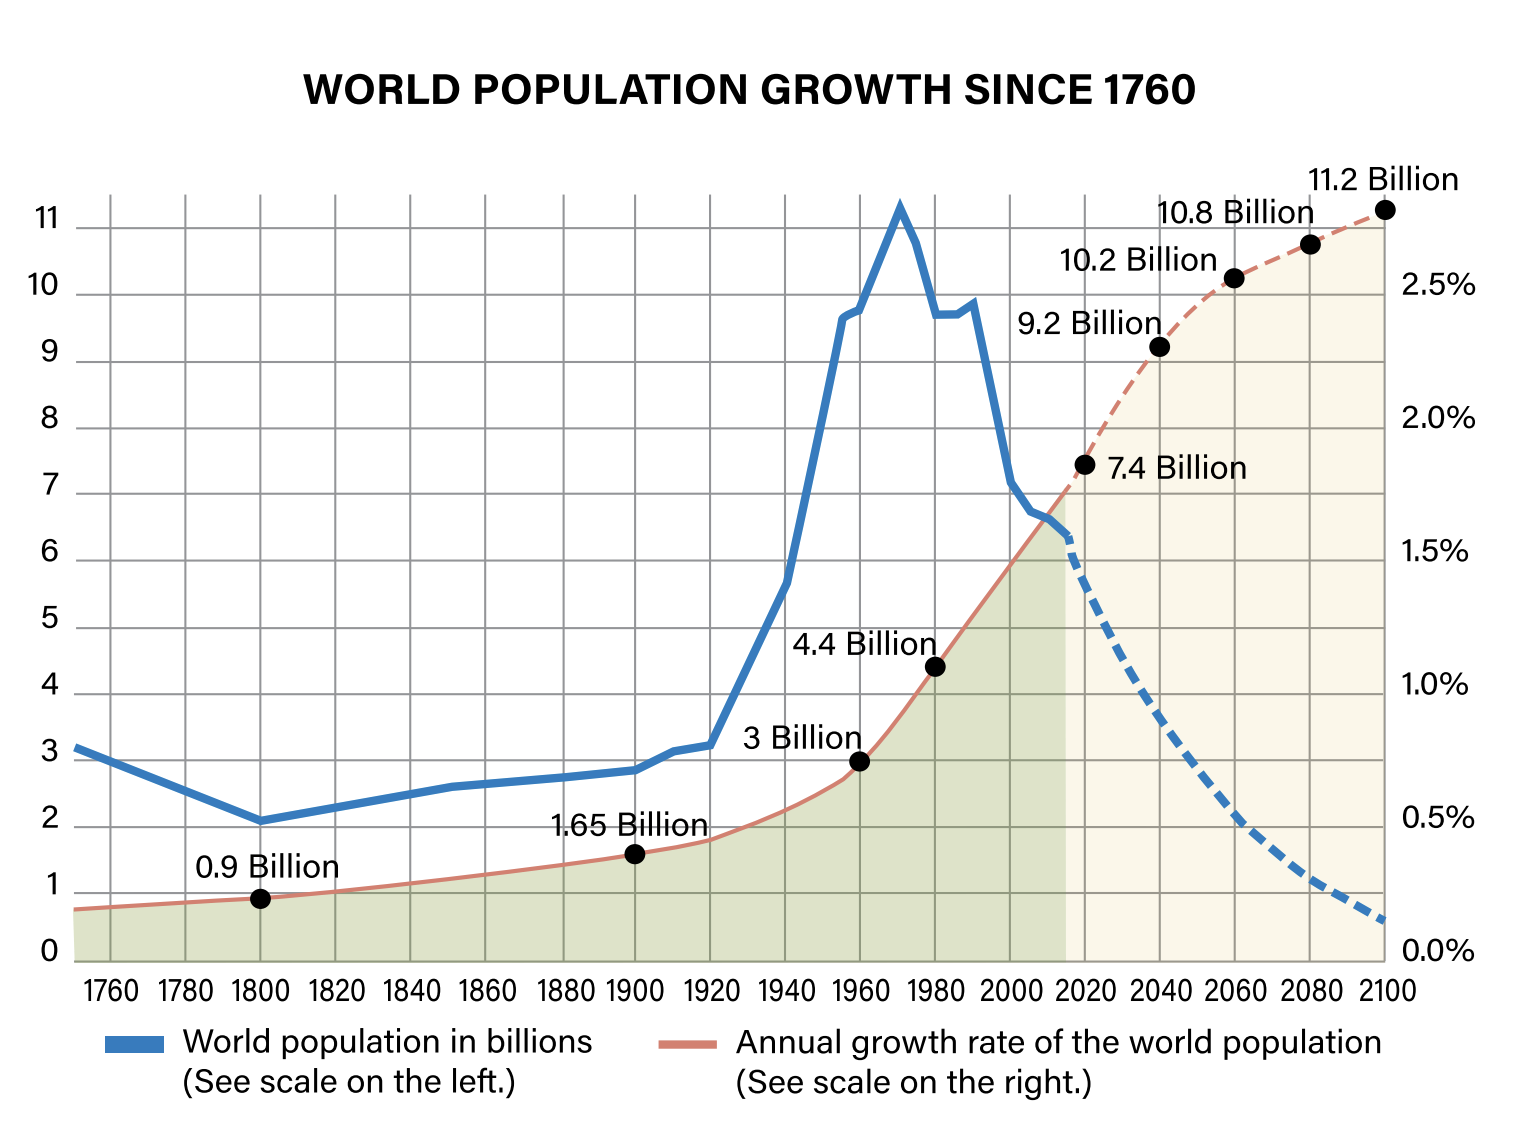
The growth rate of a country’s population reveals crucial insights into its future. From bustling cities with thriving economies to regions struggling with poverty, population growth rates can indicate a country’s economic potential and the challenges it may face. By examining these growth rates, we can understand a lot about a country’s current state and predict future trends. Let’s explore what population growth can tell us about a country’s trajectory.
Understanding Population Pyramids
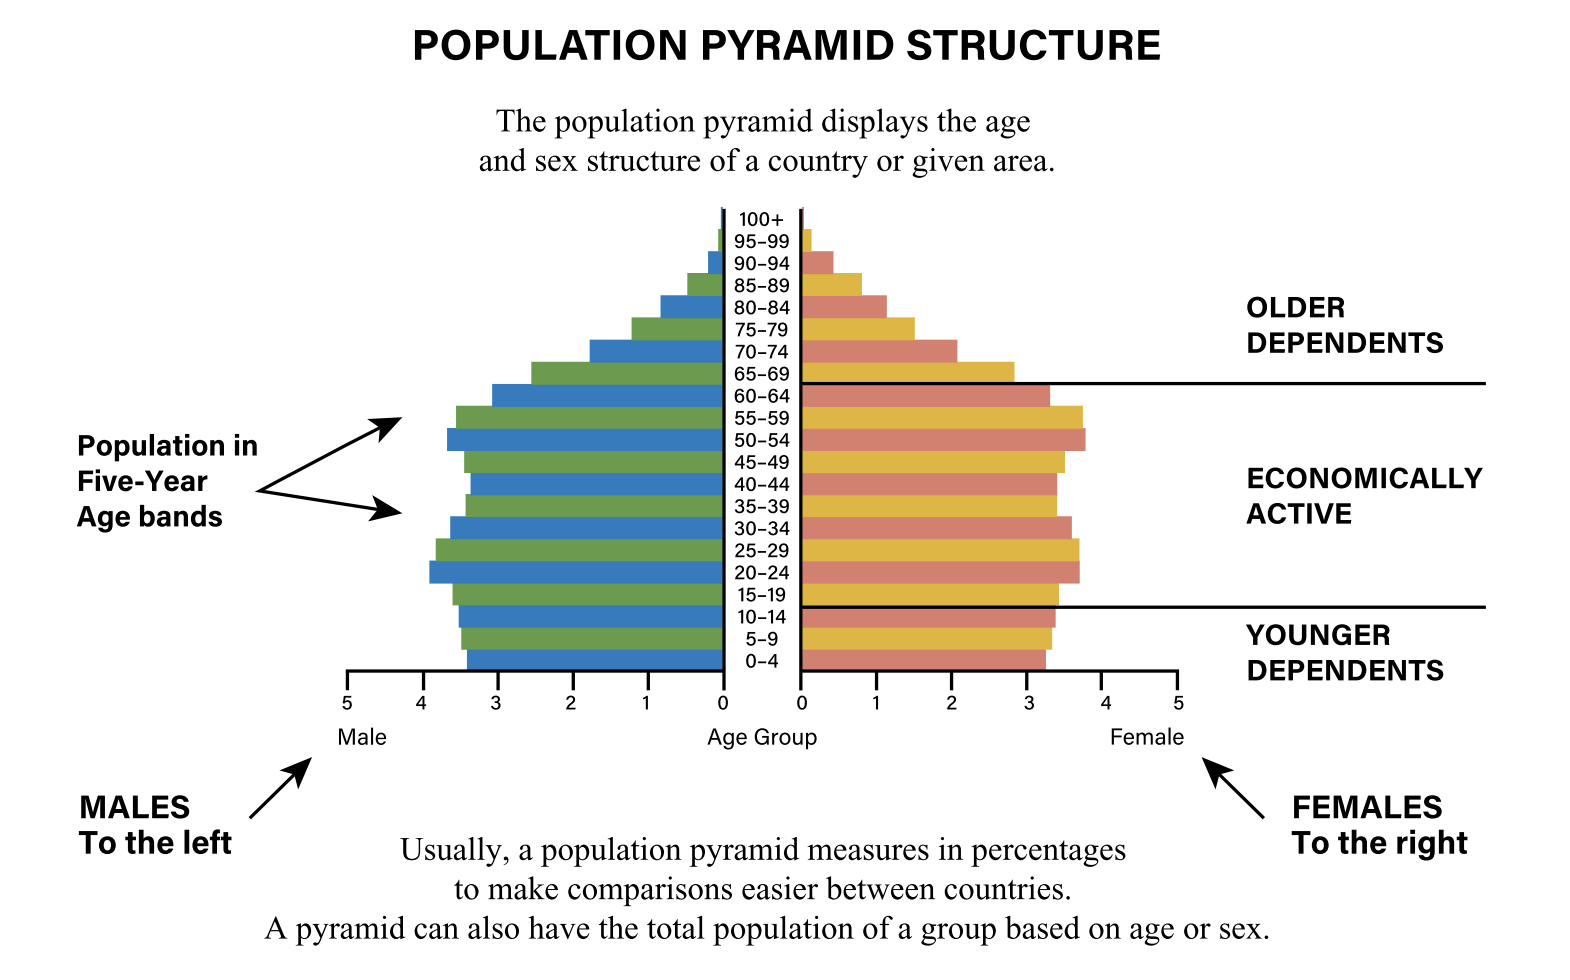
Population pyramids are graphical representations that show the age and sex distribution of a population. They are essential tools for demographers, the experts who study population dynamics. By analyzing these pyramids, we can determine the population’s growth patterns and make predictions about future trends.
Age Cohorts and Sex Ratio
- Age Cohorts: These are groups of people of the same age within a population. For example, a cohort might include everyone aged 0-4, 5-9, 10-14, and so on.
- Sex Ratio: This is the ratio of males to females in a population. It can affect social structures and influence future population growth.
Dependency Ratio
- Dependency Ratio: This ratio compares the number of dependents (people aged 0-14 and over 65) to the working-age population (15-64). A high dependency ratio means that fewer people are working to support the non-working population, which can strain economic resources.
Pre/Post Reproductive Cohorts
- Pre-Reproductive Cohorts: These are age groups that have not yet reached reproductive age (0-14 years).
- Post-Reproductive Cohorts: These are age groups that are beyond reproductive age (65+ years).
Reading Population Pyramids
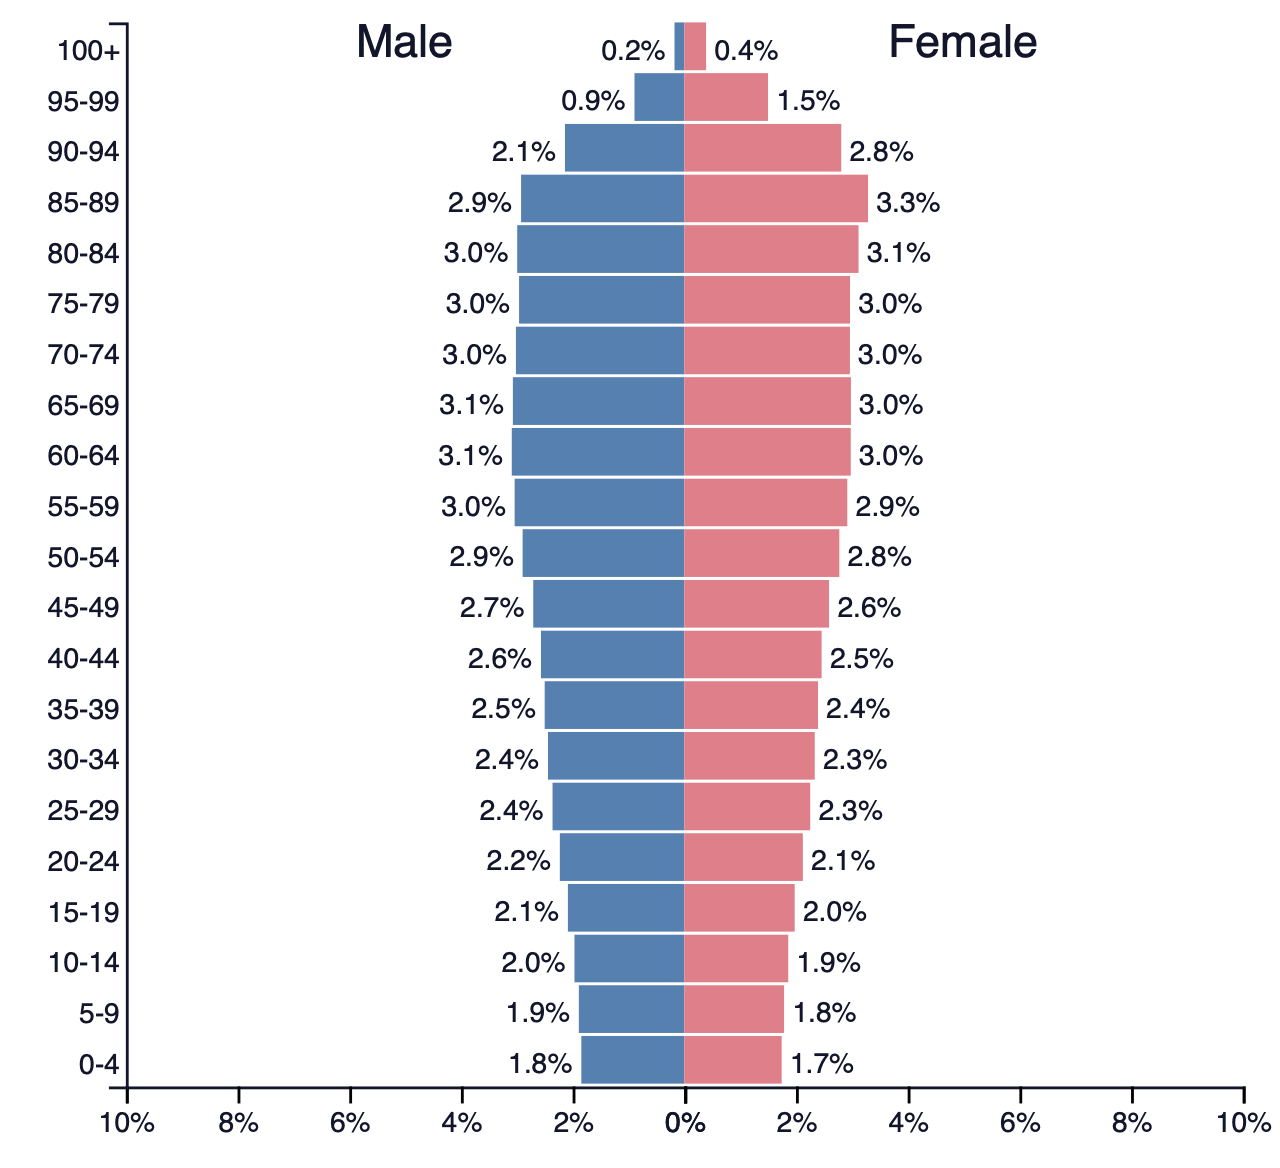
By examining the shape of a population pyramid, you can determine whether a population is growing rapidly, growing slowly, stabilizing, or beginning to decrease.
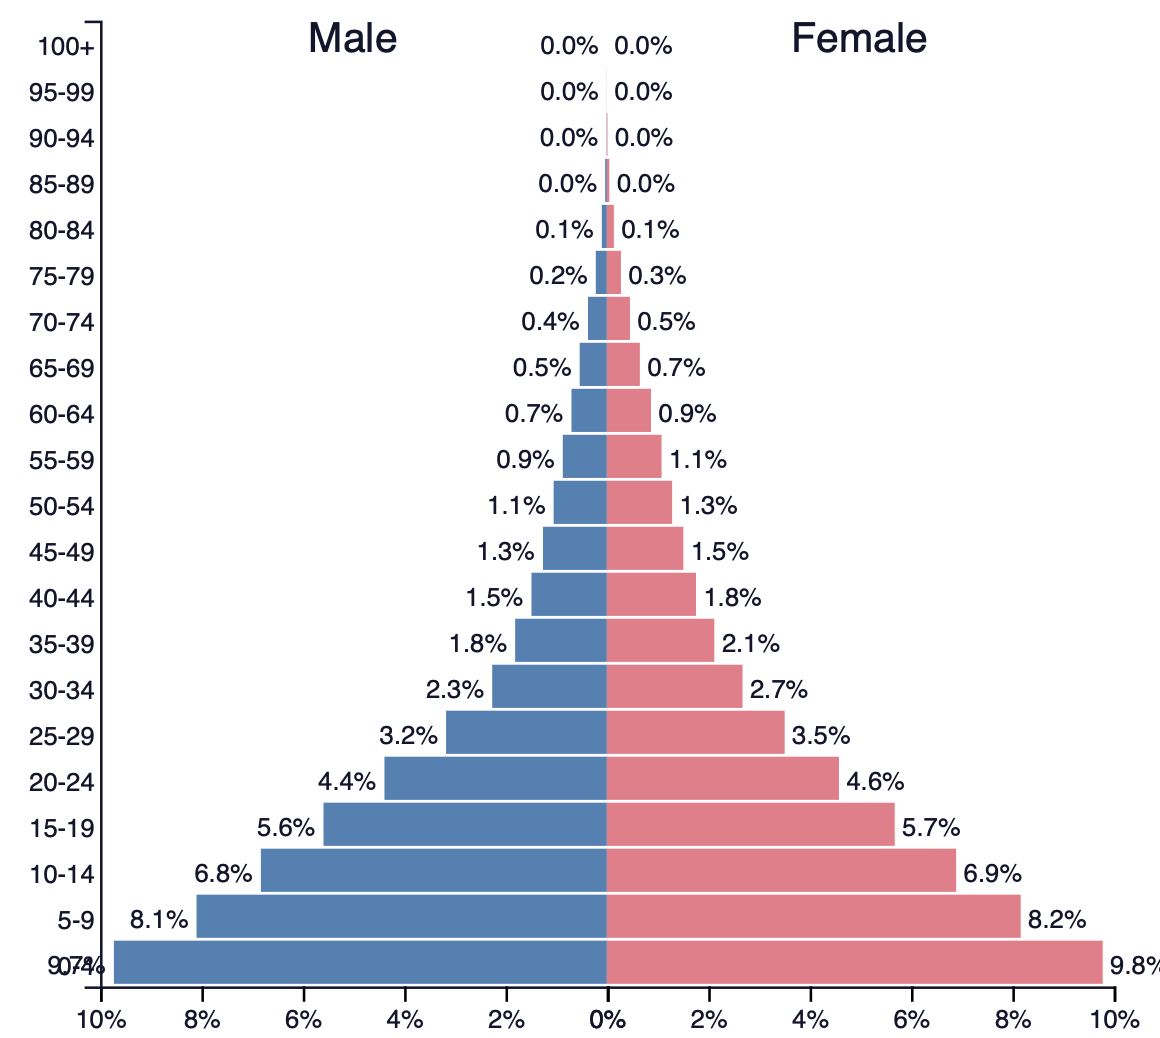
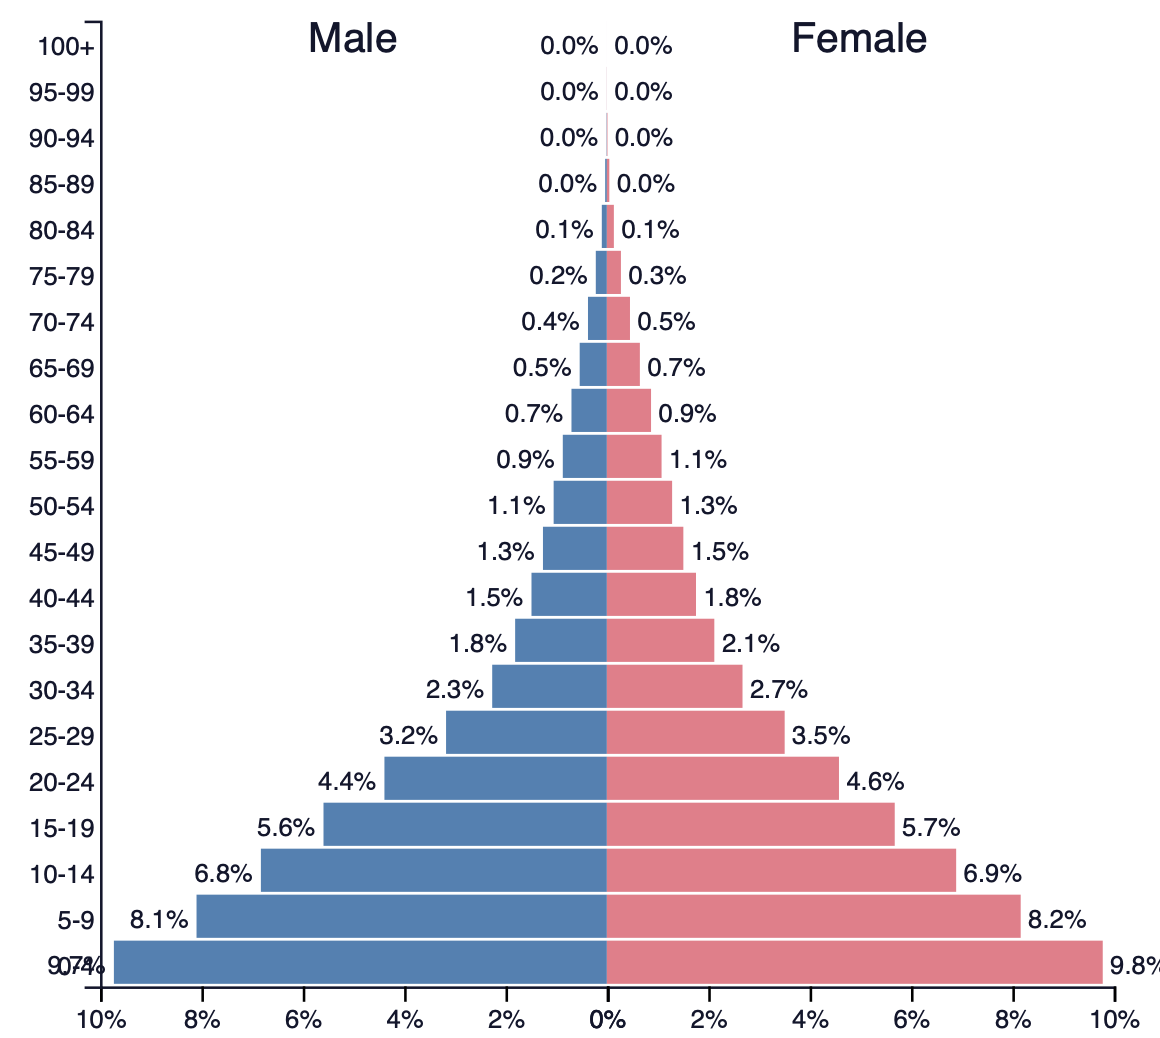
Rapidly Growing Population: A pyramid with a broad base and a narrow top indicates a high birth rate and a high proportion of young people.
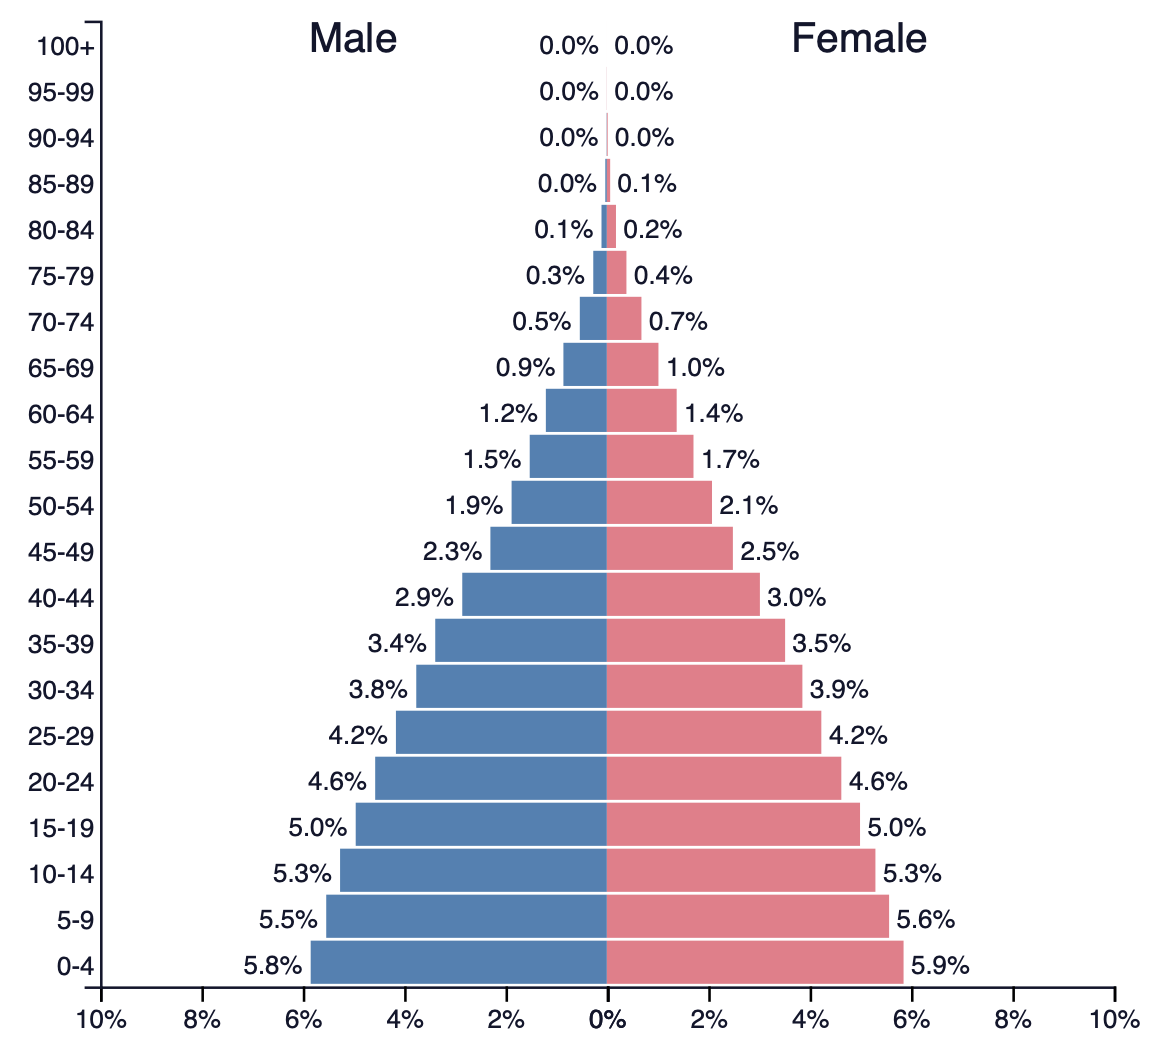
Growing Population: A pyramid with a slightly wider base than the middle suggests steady growth.
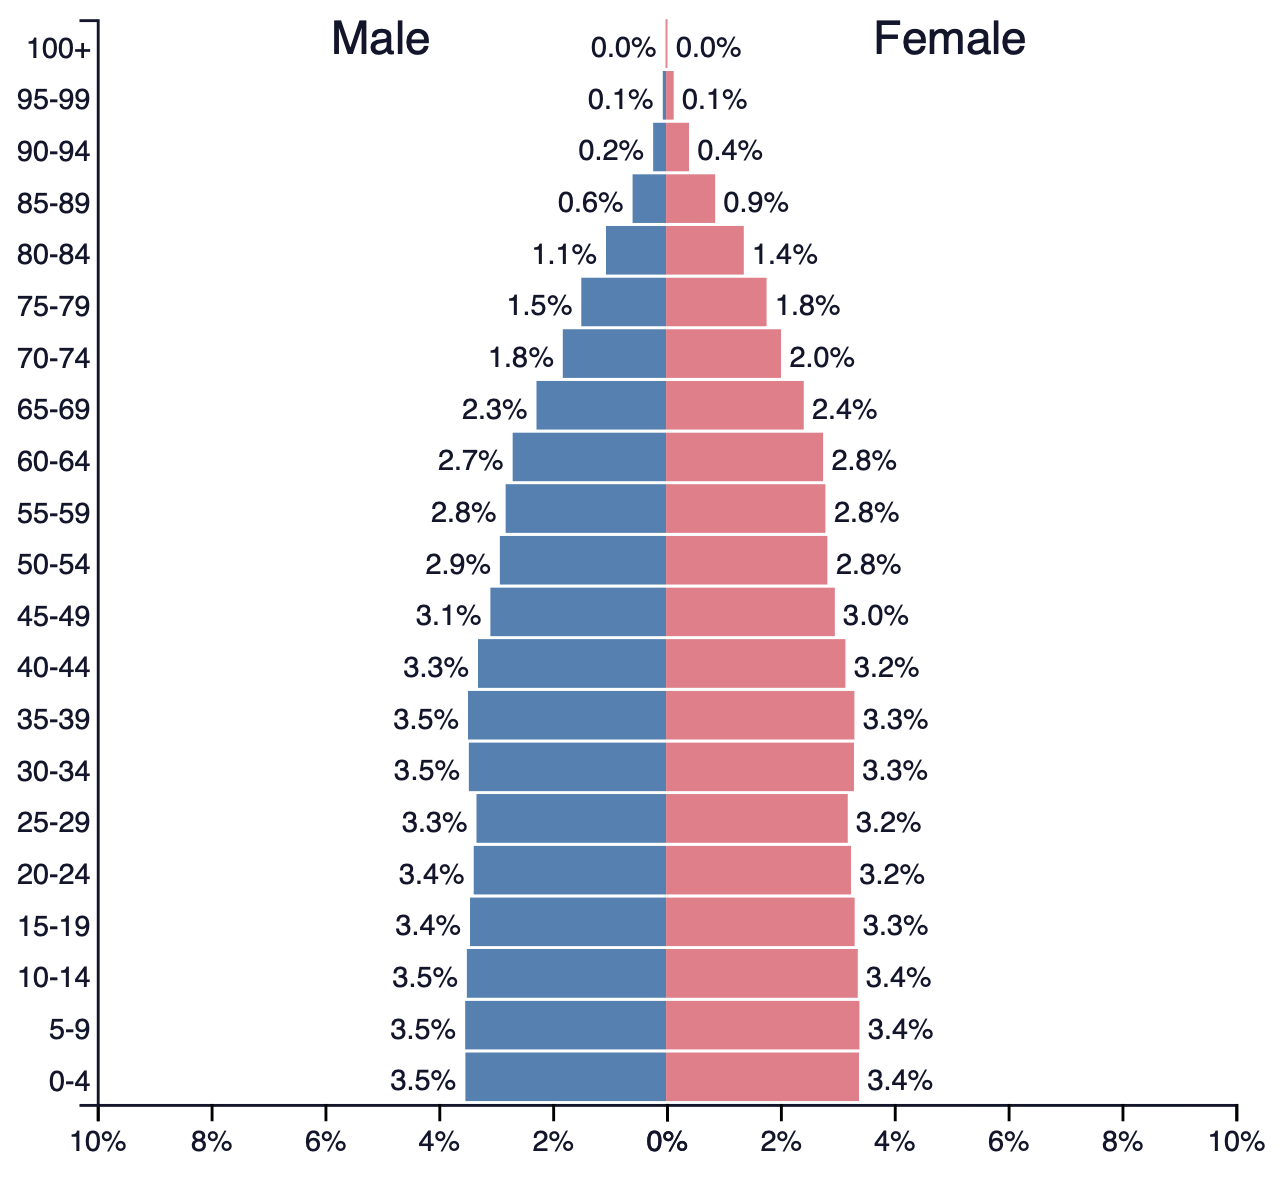
Stabilizing Population: A more rectangular-shaped pyramid indicates that the population is stabilizing, with birth rates and death rates in balance.
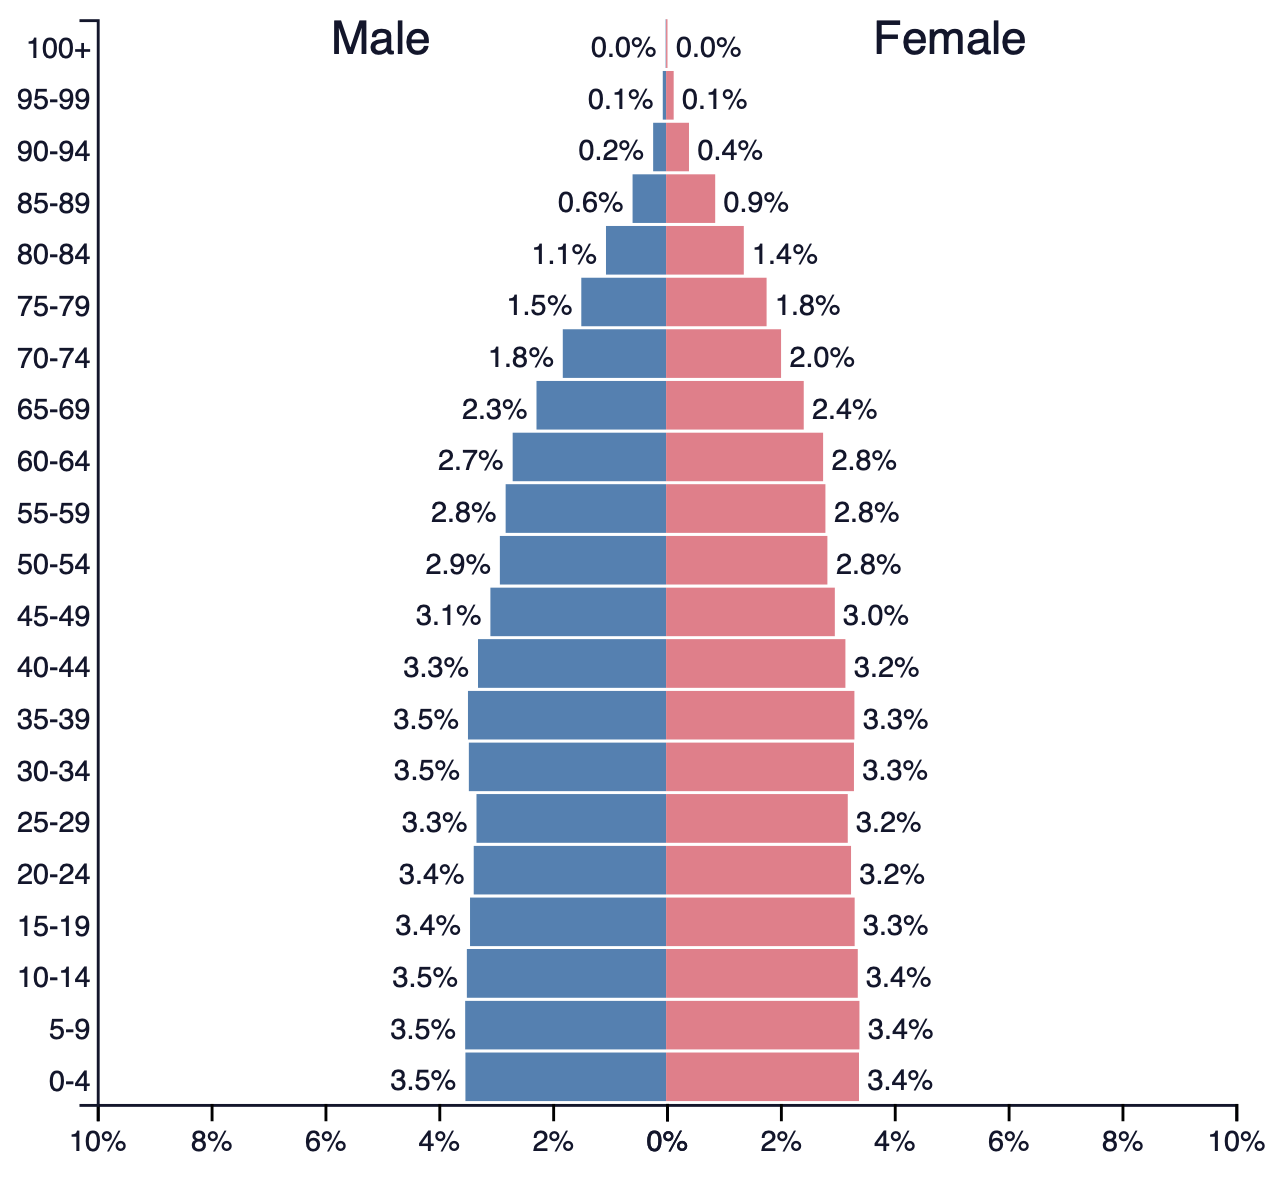
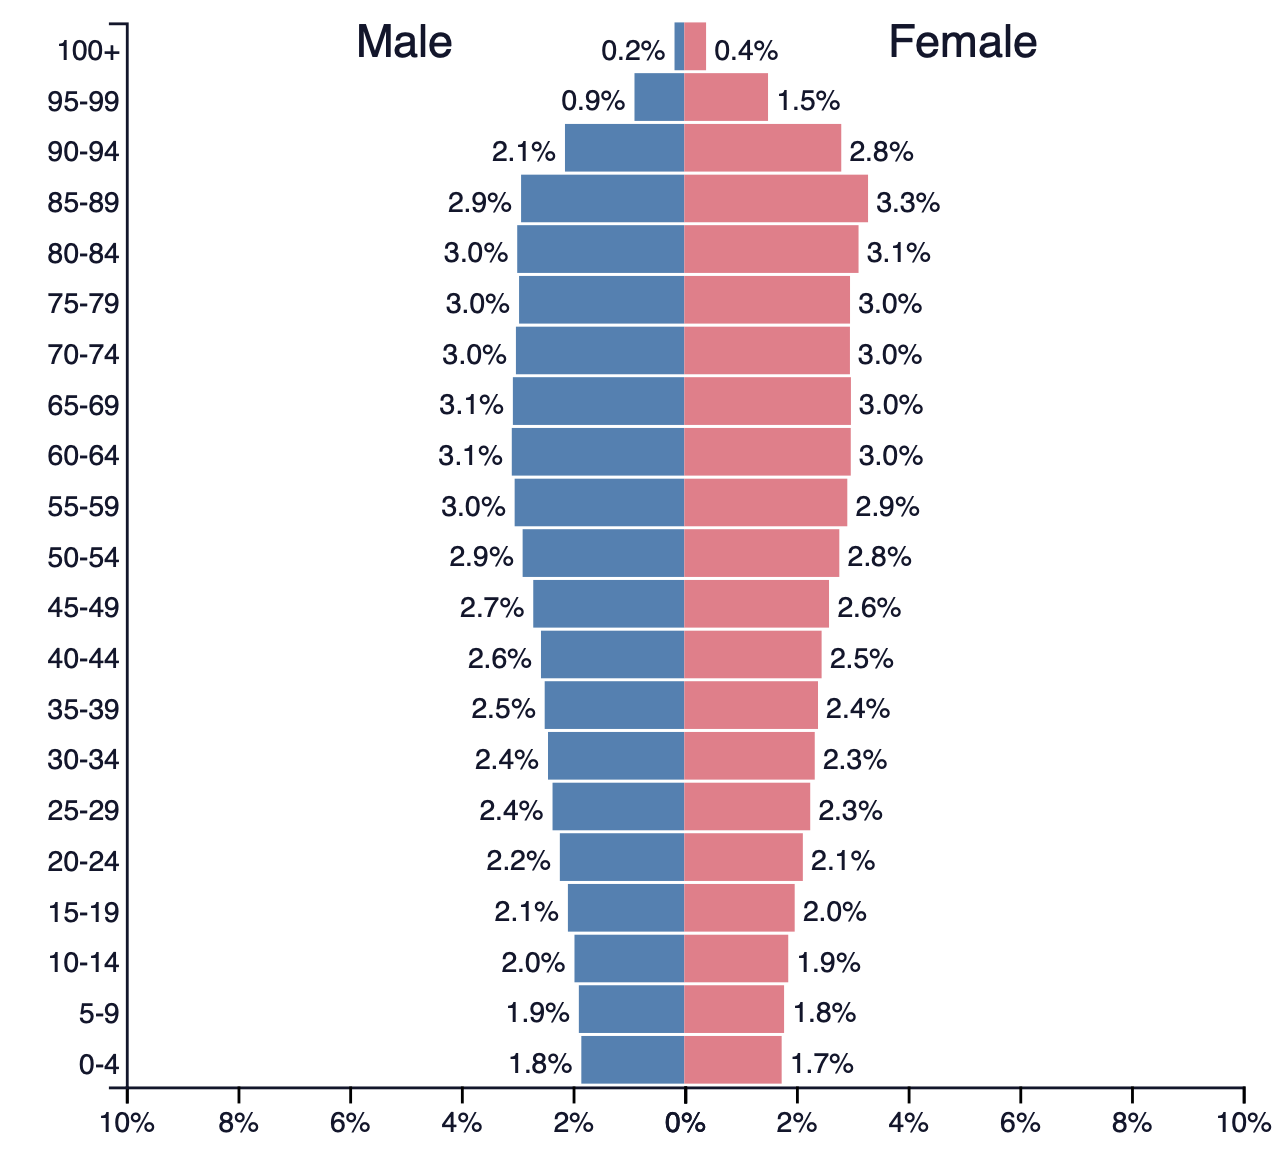
Decreasing Population: A pyramid with a narrower base than the middle shows that the birth rate is lower than the death rate, leading to a decreasing population.
Measuring Population Growth
Demographers use various metrics to measure population growth and predict future trends. Here are some key terms and concepts:
- Crude Birth Rate (CBR): The number of live births per 1,000 people in a year.
- Crude Death Rate (CDR): The number of deaths per 1,000 people in a year.
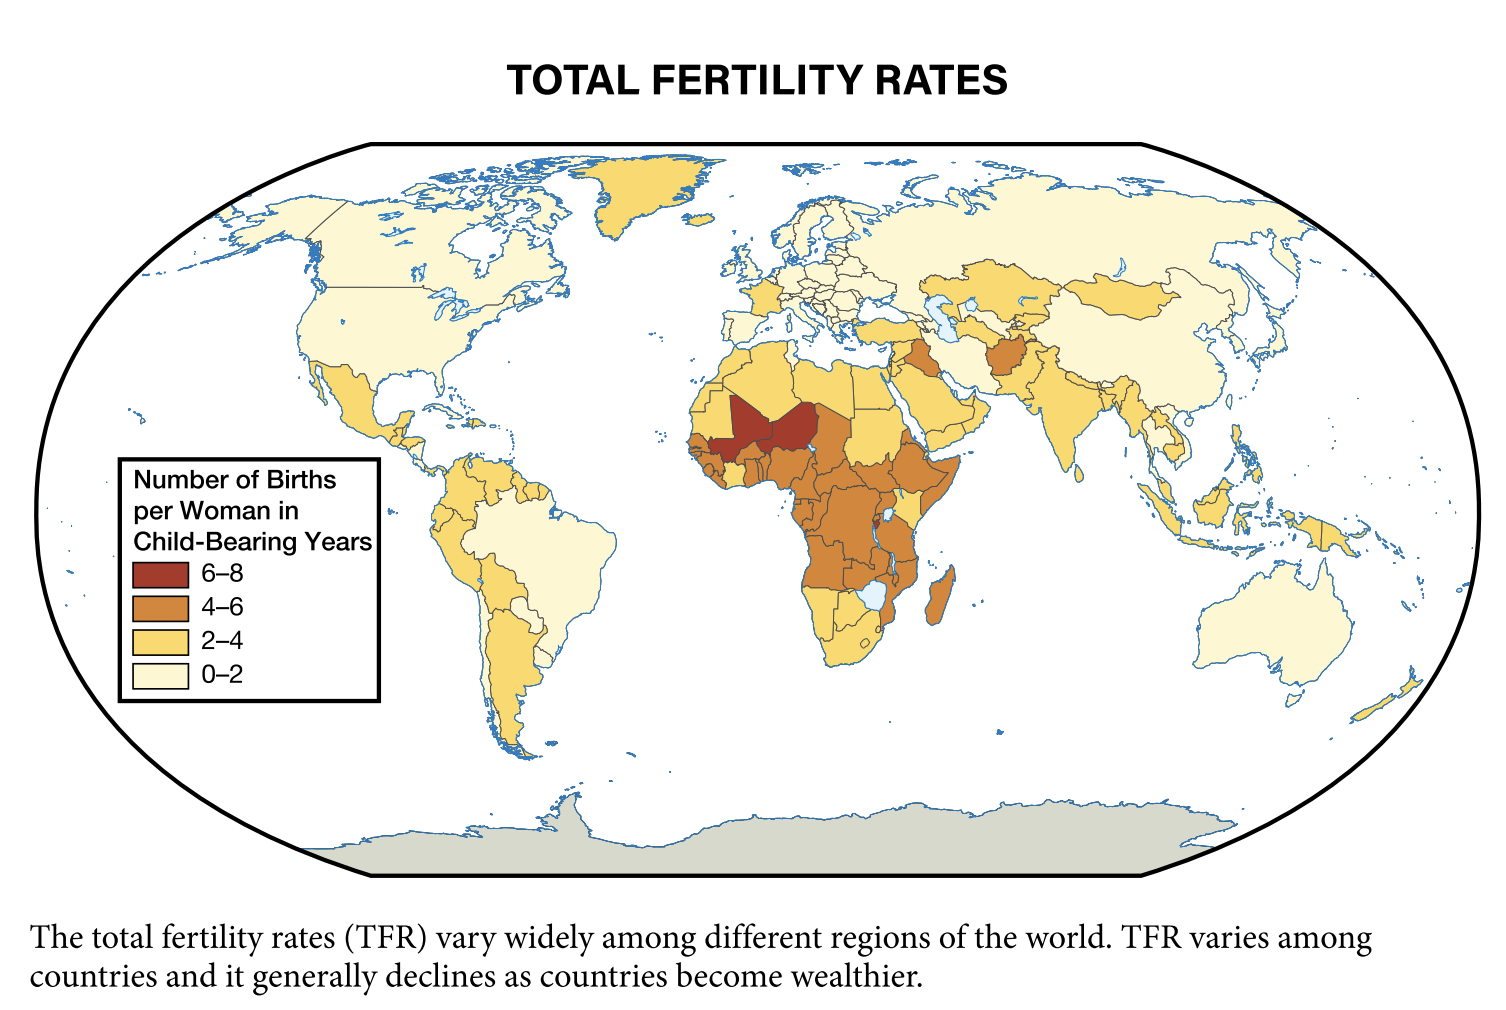
- Total Fertility Rate (TFR): The average number of children a woman is expected to have during her lifetime.
- Infant Mortality Rate (IMR): The number of infant deaths (under one year old) per 1,000 live births in a year.
- Natural Increase Rate (NIR): The difference between the crude birth rate and the crude death rate, indicating population growth excluding migration.
- Doubling Time: The number of years it takes for a population to double in size, given its current growth rate.

Interpreting Demographic Metrics
Crude Birth Rate (CBR)
The Crude Birth Rate is a straightforward measure that tells us how many babies are born in a given year per 1,000 people. A high CBR indicates a young, growing population, while a low CBR suggests an aging population with fewer young people. Countries with high birth rates often face challenges related to providing adequate education, healthcare, and employment opportunities for their young populations.
Crude Death Rate (CDR)
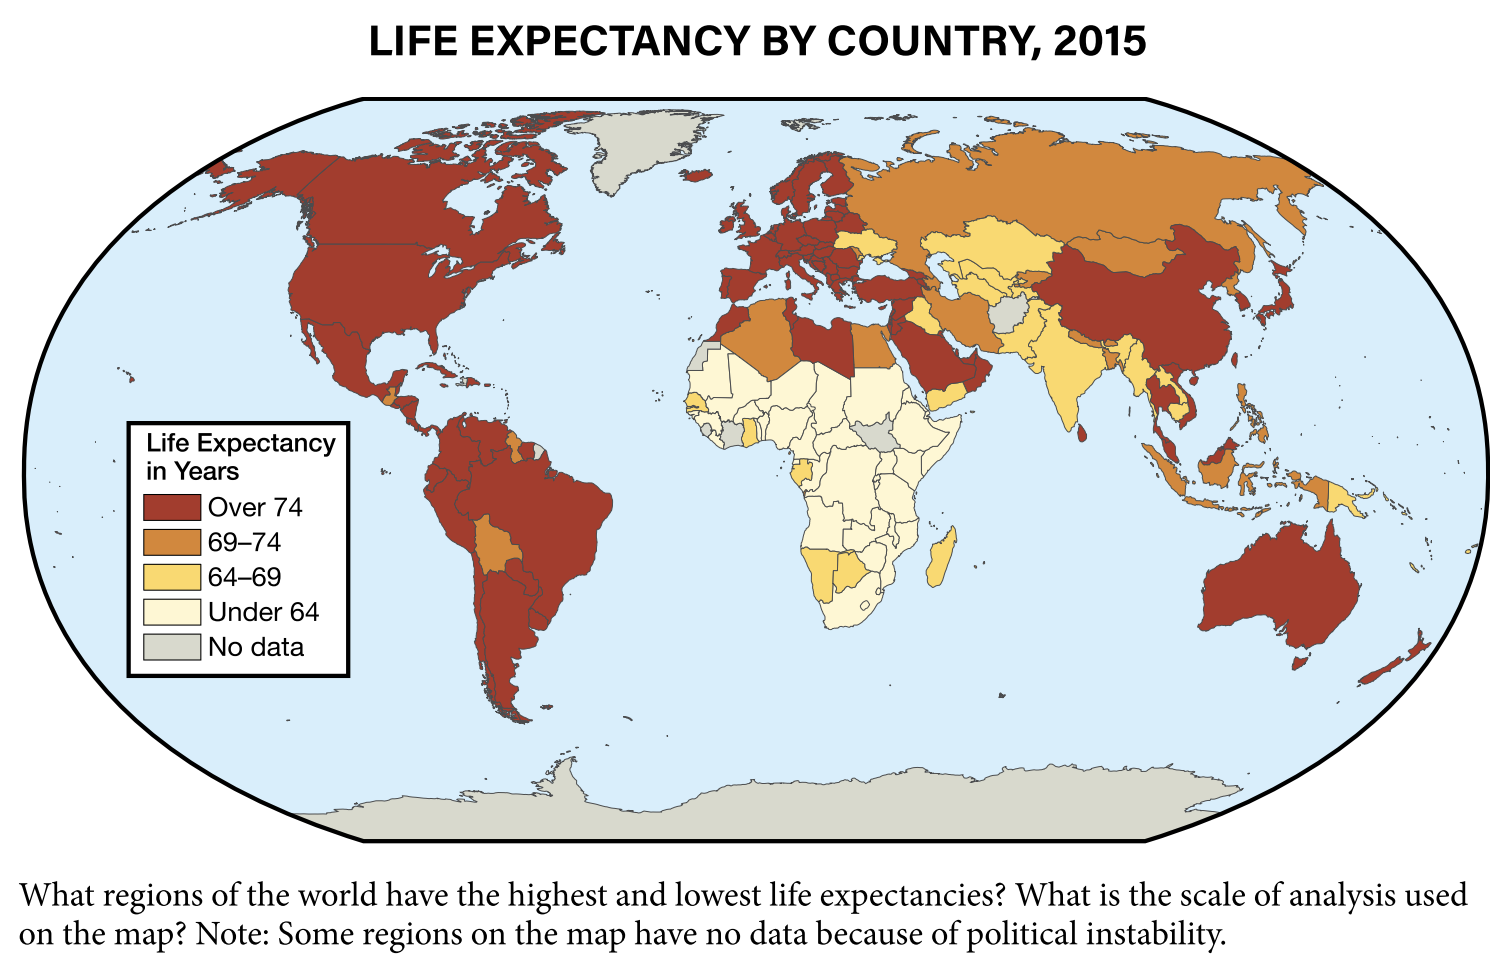
The Crude Death Rate measures how many people die in a given year per 1,000 people. A high CDR can indicate poor health conditions, widespread disease, or an aging population. Conversely, a low CDR suggests better health care, higher living standards, and potentially a younger population.
Total Fertility Rate (TFR)
The Total Fertility Rate is a more refined measure than the CBR, as it estimates the average number of children a woman will have during her reproductive years. A TFR of about 2.1 is considered the replacement level, meaning the population is stable. A TFR higher than 2.1 indicates population growth, while a lower TFR suggests a declining population. Understanding TFR helps us predict long-term population trends and plan for future needs.
Infant Mortality Rate (IMR)
The Infant Mortality Rate is a critical indicator of a country’s health system. It measures the number of infants who die before reaching one year of age per 1,000 live births. A high IMR often points to inadequate healthcare, poor nutrition, and lack of access to clean water and sanitation. Reducing the IMR is crucial for improving overall population health and ensuring a stable population growth rate.
Natural Increase Rate (NIR)
The Natural Increase Rate is the difference between the Crude Birth Rate and the Crude Death Rate. It shows how quickly a population is growing without considering migration. A positive NIR means the population is increasing, while a negative NIR indicates a shrinking population. This rate is essential for understanding the natural population growth and its implications for resource allocation and economic planning.
Doubling Time
Doubling Time refers to the number of years it takes for a population to double in size at its current growth rate. It provides a sense of how rapidly a population is expanding. For example, if a country has a high NIR, its doubling time will be shorter, indicating rapid population growth. This can lead to increased demand for resources, infrastructure, and services, posing challenges for sustainable development.
The Implications of Population Growth
Understanding these demographic metrics helps us see beyond the numbers and grasp the broader implications of population growth. Let’s consider a few scenarios to illustrate how these metrics can influence a country’s future.
Economic Impact
A rapidly growing population can be a double-edged sword. On one hand, it means a larger workforce, which can drive economic growth and innovation. On the other hand, it can strain resources and infrastructure if the growth outpaces the country’s ability to provide jobs, education, and healthcare. Countries with high TFR and NIR need to invest heavily in their youth to harness this potential demographic dividend.
Social Impact
High population growth can also affect social structures. For instance, a high dependency ratio can put pressure on working-age individuals to support both the young and the elderly. This can lead to economic stress and influence social policies related to pensions, healthcare, and education. Understanding population dynamics is crucial for creating policies that support a balanced and healthy society.
Environmental Impact
Population growth has significant environmental implications. A larger population increases the demand for natural resources, such as water, food, and energy. High population density can lead to overuse of these resources, causing environmental degradation and reducing the carrying capacity of the land. Sustainable development requires careful management of population growth to ensure that resources are used efficiently and the environment is protected for future generations.
Political Impact
Demographic trends can influence political stability and power dynamics. For instance, countries with young, rapidly growing populations may experience social unrest if there are not enough economic opportunities. On the other hand, countries with aging populations might face challenges related to healthcare and pensions, influencing political decisions and priorities. Understanding demographic trends is essential for policymakers to address these challenges proactively.
Case Studies: Reading Population Pyramids
Let’s look at a few examples of population pyramids to see how they reflect a country’s demographic trends and potential future challenges.
Country A: Rapid Growth
Country A has a population pyramid with a broad base and a narrow top, indicating a high birth rate and a young population. This suggests that the country is experiencing rapid population growth. Challenges for Country A include providing sufficient education, healthcare, and employment opportunities for its young population. However, if managed well, this demographic can drive significant economic growth.
Country B: Stabilizing Population
Country B’s population pyramid is more rectangular, with balanced age cohorts. This indicates a stabilizing population, where birth and death rates are roughly equal. Country B can focus on maintaining its current standard of living and ensuring sustainable development. The challenge is to continue providing quality services and opportunities without significant population growth.
Country C: Declining Population
Country C’s population pyramid has a narrow base and a wider middle, showing a low birth rate and an aging population. This suggests a declining population, which can lead to a shrinking workforce and increased pressure on social services for the elderly. Country C needs to address issues related to pensions, healthcare, and potential labor shortages to ensure economic stability.
A Baby Boom
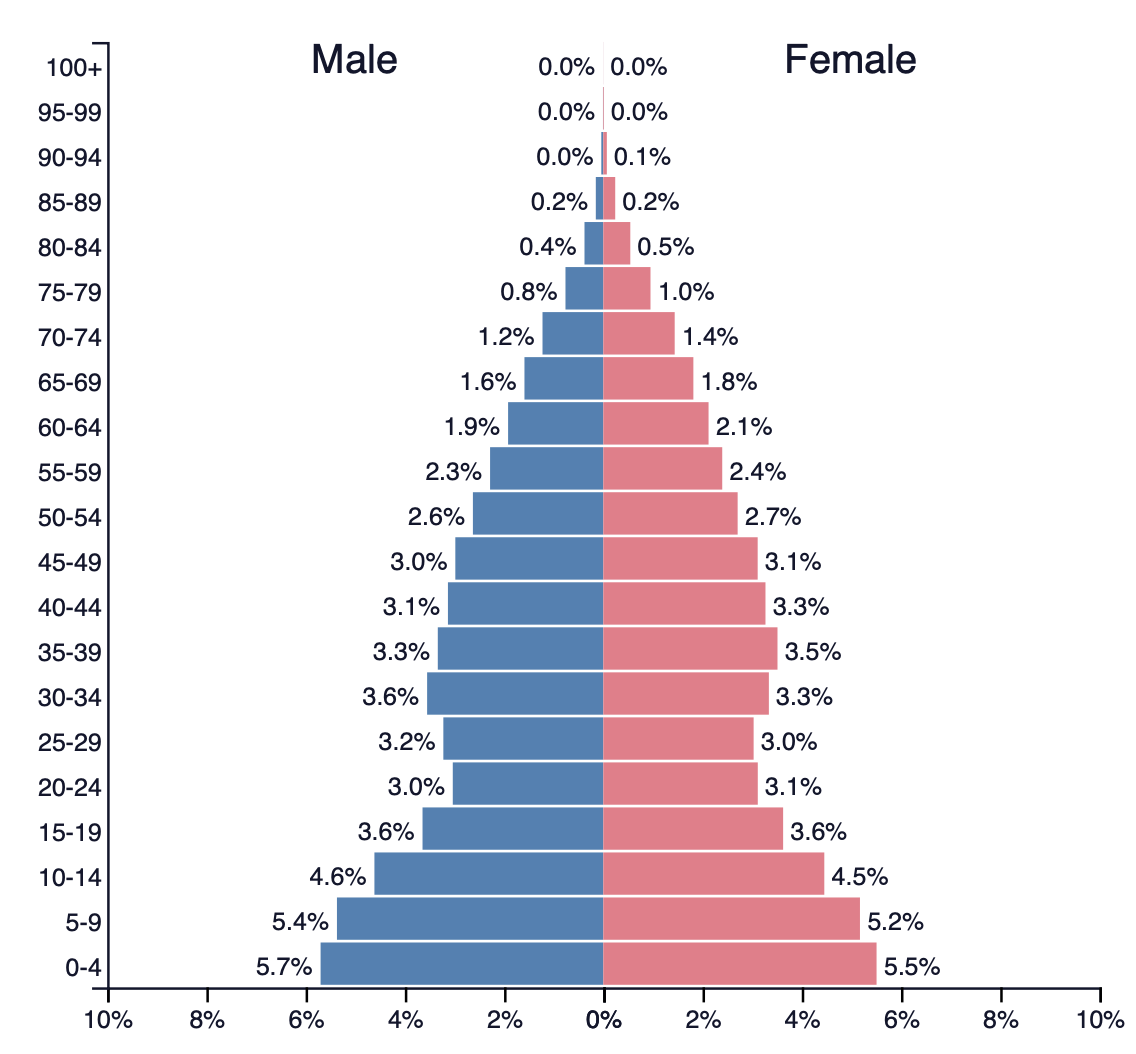
A significant example of rapid population growth is the baby boom. A baby boom occurs when there is a sudden, large increase in the birth rate, often following major events such as wars or economic prosperity. One of the most well-known baby booms occurred after World War II. Between 1946 and 1964, many countries, particularly in the West, experienced a substantial rise in birth rates. This period is marked by the birth of the “Baby Boomer” generation.
The causes of a baby boom can include:
- Economic Prosperity: Post-war economic booms provide financial stability, encouraging families to have more children.
- Social Changes: After significant disruptions, such as wars, people may feel a sense of urgency to start or expand families.
- Government Policies: Pro-natalist policies that encourage higher birth rates through incentives and support for families can also contribute to a baby boom.
The effects of a baby boom are far-reaching:
- Economic Impact: Initially, a baby boom can lead to economic growth due to increased demand for goods and services related to child-rearing. In the long term, however, as this generation ages, it can lead to higher dependency ratios and increased pressure on social services and pensions.
- Social Impact: Baby booms can lead to larger school enrollments and eventually a larger workforce. They can also cause generational shifts in social norms and values.
- Population Pyramids: A baby boom creates a noticeable bulge in the population pyramid, reflecting the large number of births during the boom period.
