Economic Descriptors
formal economy
informal economy
Social Measures
fertility rate
infant mortality rate
access to healthcare
literacy rate
Economic Measures
Gross Domestic Product (GDP)
Gross National Product (DNP)
Gross National Income (GNI)
Gender Inequality Index (GII)
Human Development Index (HDI)
Role of Energy
fossil fuels
renewable resources
Measures of Development
Geographers use several statistics to indicate the overall wealth of a country and its people. Three of the most common are Gross Domestic Product (GDP), Gross National Product (GNP), or Gross National Income (GNI). These vary slightly, based on issues such as whether money earned by a U.S. citizen working in Korea should be credited to the United States or to Korea. However, they are all attempts to measure the total output of a country.
GNP and GNI The dollar amount of all goods and services produced by a country’s citizens in one year is measured in the Gross National Product (GNP) and the Gross National Income (GNI). These terms are very similar and often used interchangeably. They involve the money generated by citizens and businesses of a country, regardless of where the citizens are, or live, when money is earned. For example, the income of American citizens working in South Korea and the profits from an American-owned factory in Mexico would both count as part of the United States GNP and GNI. The money made by Mexican migrant workers in a foreign-owned factory on U.S. soil would not count as part of the United States’ GNP or GNI.
GDP
The dollar amount of all final goods and services produced within a country in one year is the Gross Domestic Product (GDP). GDP is based more upon geography in the sense that it involves money generated by any business or person within a country. Only money earned in the United States, regardless of who earns it, will be used to calculate the United States’ GDP. It does not matter if the money stays in the country where it was earned–the key is that the money was generated within the country. For example, the income earned by Mexican migrant workers, or the profits from a foreign-owned factory on U.S. soil, would count as part of the United States GDP. This is true even if the migrant workers sent much of their earnings back to family members in their home countries as remittances, or the profits from a foreign-owned company were leaving the country and going back to the home country.
To make comparisons among countries more useful, these statistics are adjusted in several ways:
- Countries use different currencies, so amounts are usually converted into U.S. dollars to make comparisons easier.
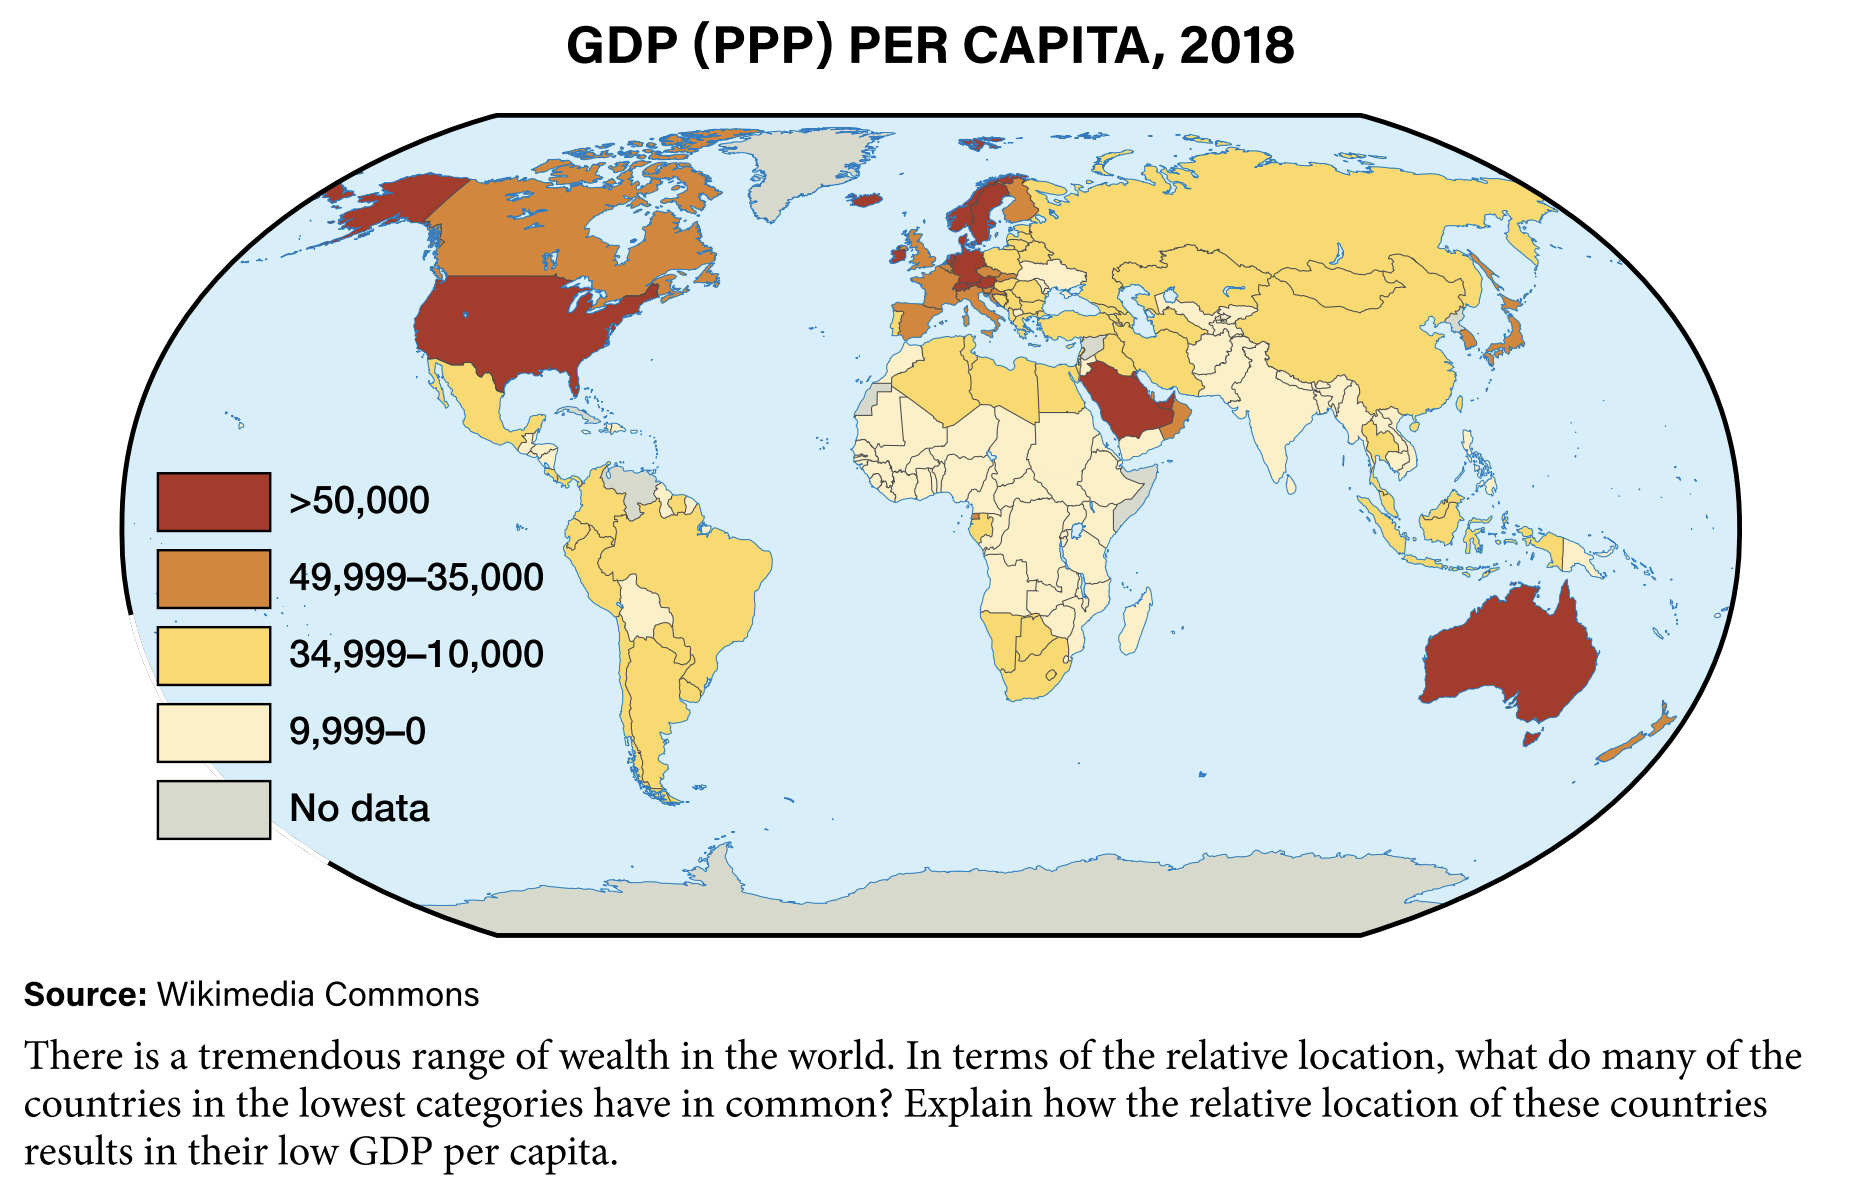
- The total size of a country’s economy influences the total size of its output. To adjust for the number of people in a country, each country’s total output can be divided by the country’s total population. This produces an amount per person, referred to as per capita. For example, in 2019, the United Kingdom and India has similar total GDPs of approximately $2.9 trillion but very different GDPs per capita. In the United Kingdom, it was about $39,000. In far more populous India, it was about $1,900.
- The prices people pay for identical goods varies from country to country because of transportation costs, the value of its currency, and other factors. To adjust for the variations in the prices of goods in various countries, economists use purchasing power parity (PPP), a measure of what similar goods cost in different countries. For example, in 2016, the same collection of goods that cost $1,000 in the United States, cost $590 in the Czech Republic and $1,620 in Switzerland. So, people with the same income in these three countries could afford more goods in the Czech Republic than in the other two countries.
All three measures of development are based upon money and it is generally accepted that the countries with the high GDP/capita, GNP/capita, or GNI/ capita are wealthy countries and therefore highly economically developed, and those with low values are poor countries and not as well developed.
Terms of Development
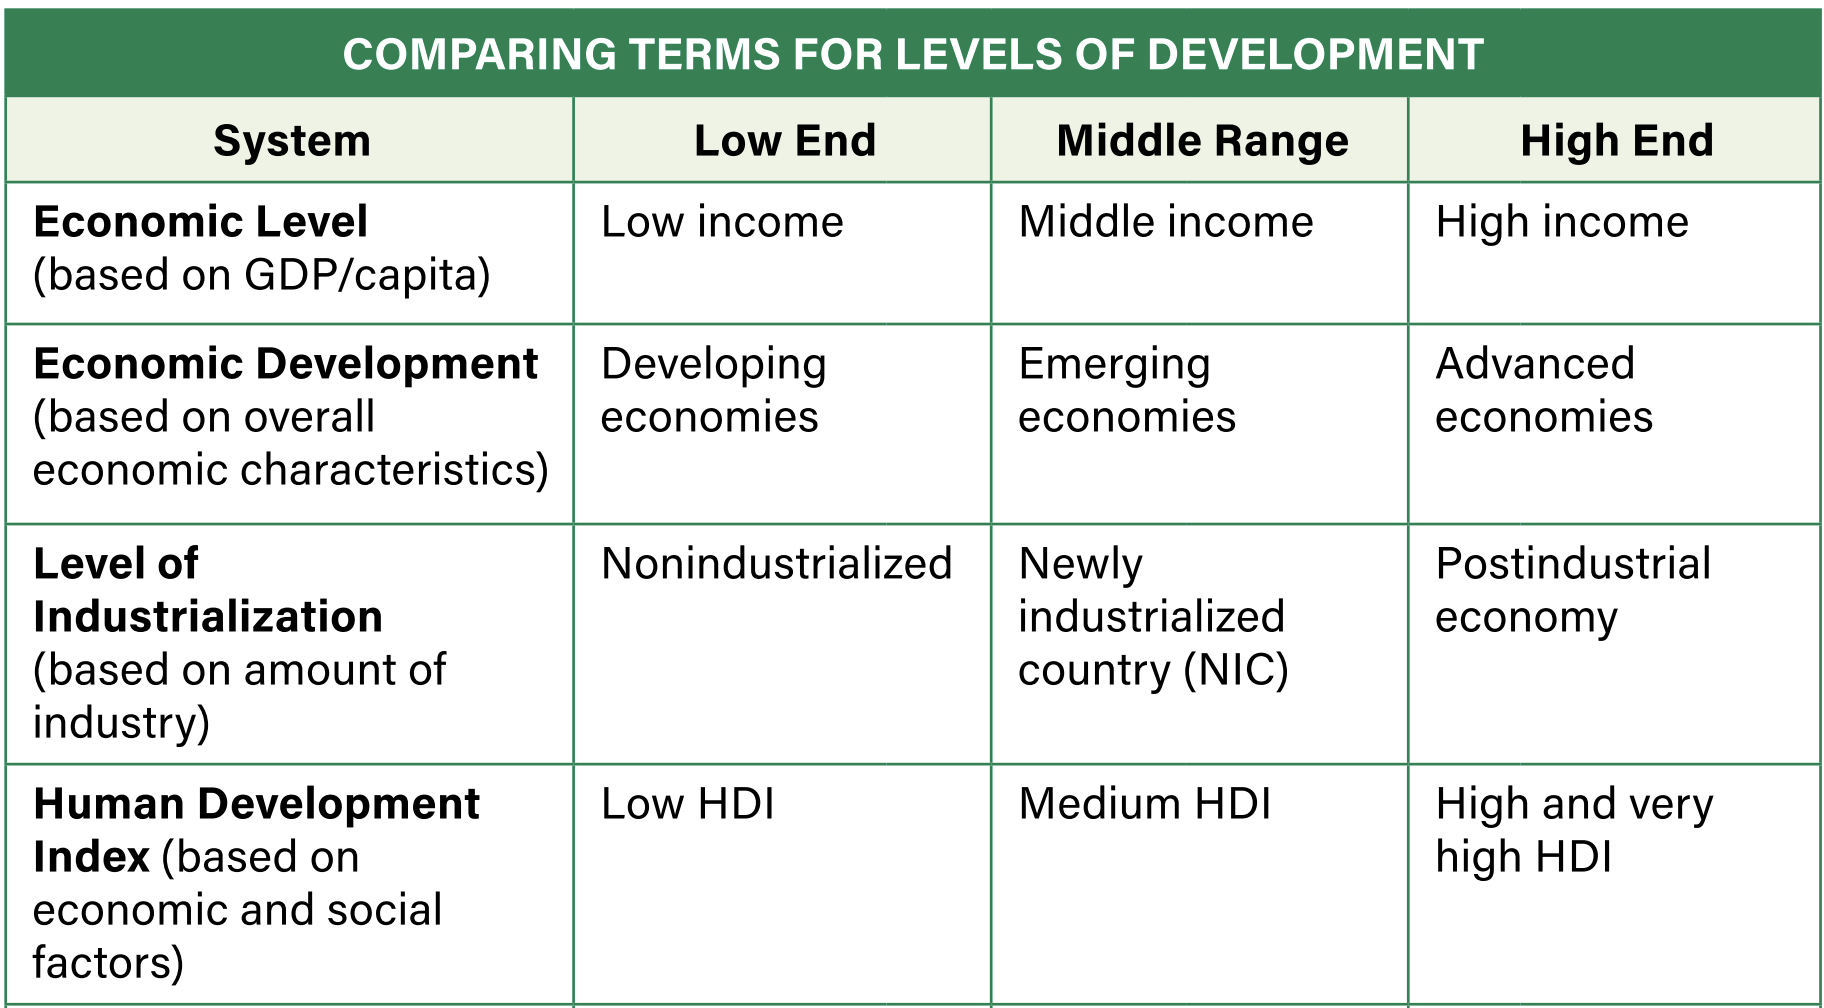
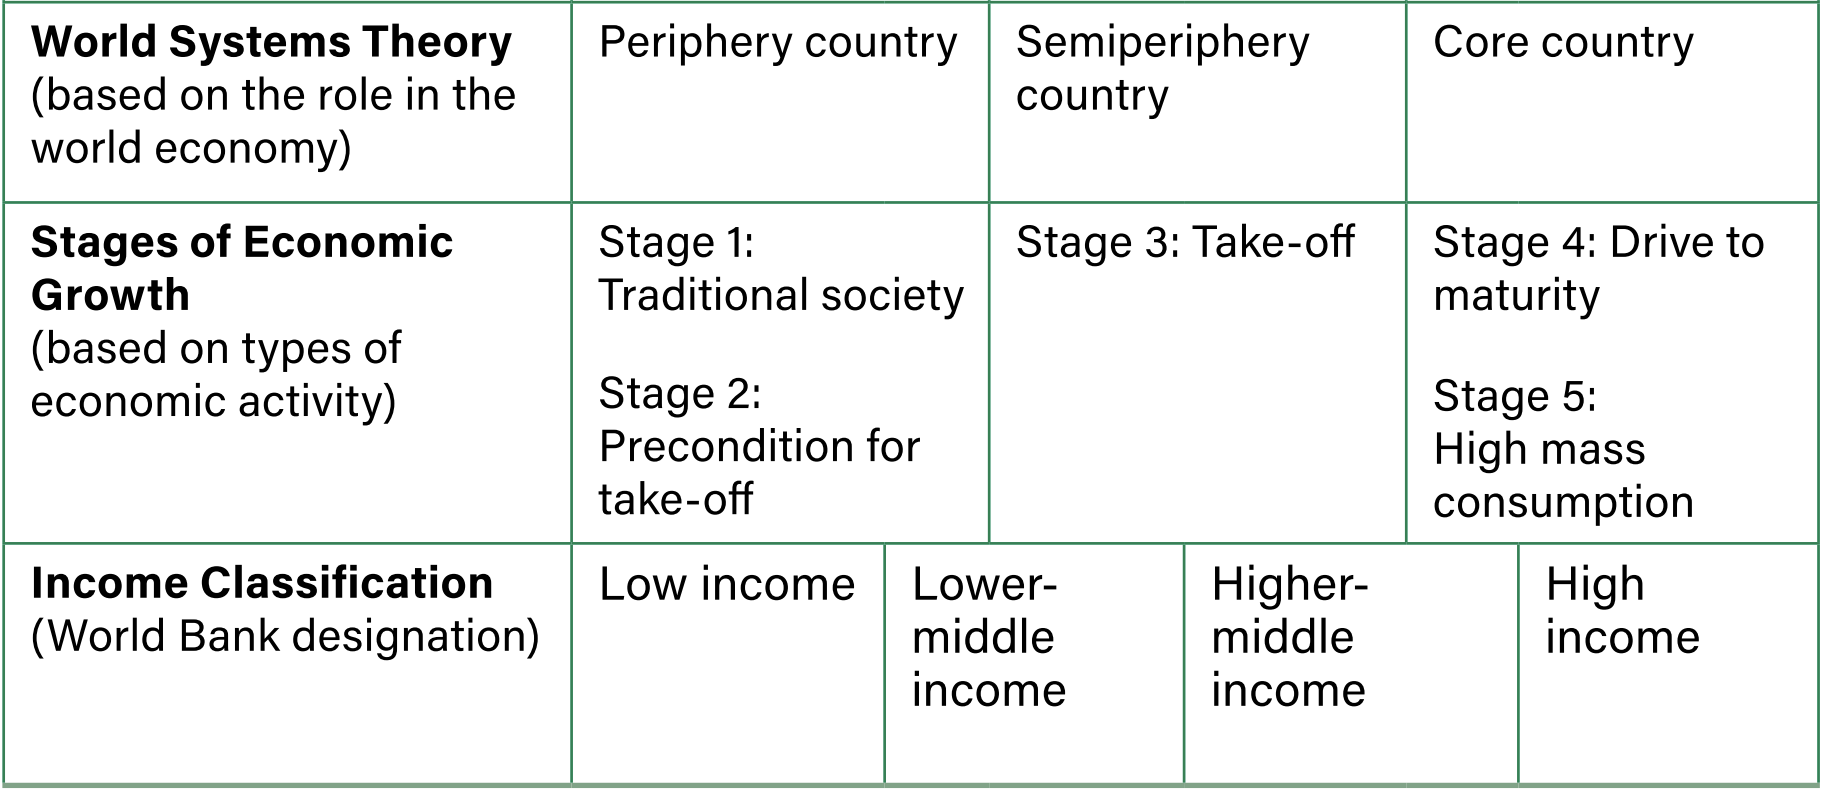
The various economic measures reflect a continuum of the relative wealth and development among countries. People use various systems to categorize countries on this continuum. Each system focuses on slightly different traits of countries, so it uses slightly different terms. However, systems divide countries broadly into low-end, middle-range, and high-end categories. The table below summarizes some of these systems.
Other Measures of Economic Development
In addition to money, other economic variables are often used to determine a country’s level of development. These include the sectoral structure of the economy, income distribution, the use of fossil fuels and renewable energy, and literacy rates.
Sectoral Structure of the Economy
The least-developed countries in the world have higher percentages of their labor force in the primary sector. In contrast, more developed countries have higher percentages in the tertiary sector. Another way to analyze an economy is to distinguish between the formal and the informal sectors. The formal sector is the portion of the economy that is monitored by the government, so people in it follow regulations and pay taxes. This is the portion of economic activity measured by GDP, GNP, and GNI.
The Informal Economy
The informal sector is the portion of the economy that is not monitored by the government. It includes several types of economic activities:
- Some activities are done without any pay, such as cleaning your own house or cooking meals for a friend who is sick. Similar services done for money are part of the formal economy.
- Some activities are legal if reported to the government but are often not reported. For example, restaurant workers can legally accept tips, but not reporting the income from tips on a tax return is illegal.
- Some activities are always illegal, such as drug dealing and identity theft.
The informal sector is sometimes called the underground economy or the shadow economy. For many people in poor countries, participating in the informal sector allows them to survive. In general, the lower the level of development, the higher the percentage of workers involved in the informal sector. In some countries, it probably includes over half of economic activity. Economists who study the shadow economy estimate that it accounts for about 10 percent of the U.S. economy.
Energy Consumption
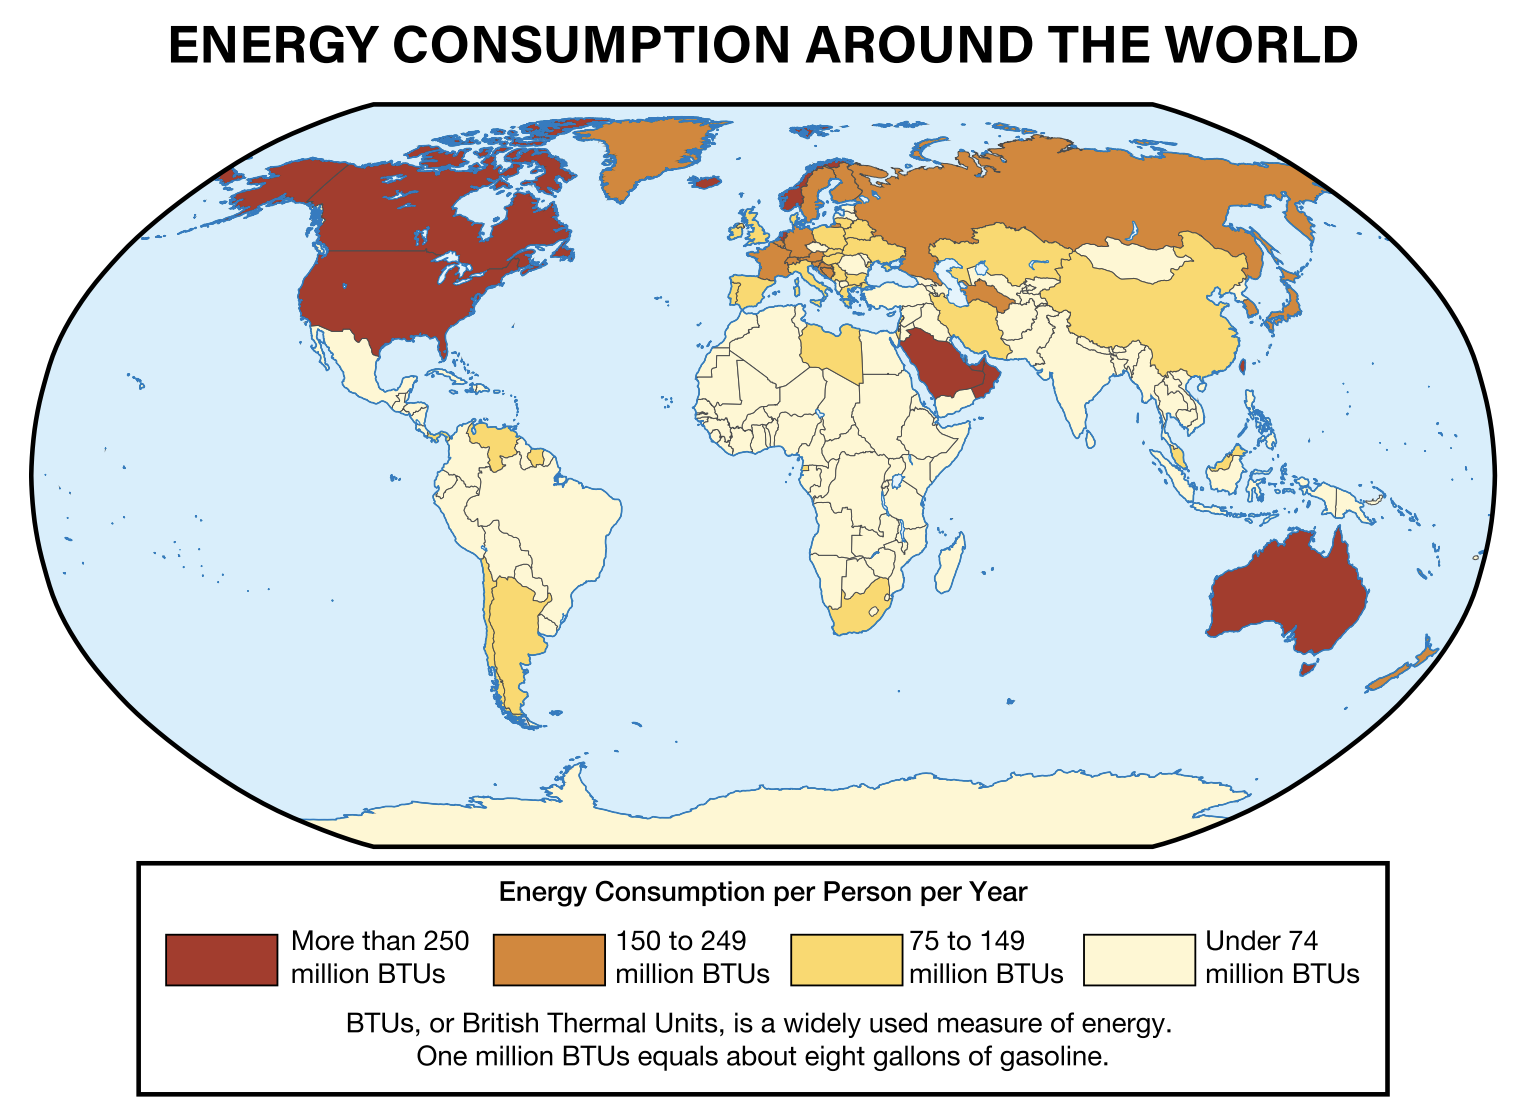
As people become more prosperous, they consume more because they can afford to purchase more goods and they live longer. For example, the United States includes about 5 percent of the world’s population but consumes about 20 percent of all resources. The spatial pattern of consumption of energy is shown in the map on the following page. At current rates of consumption, a baby born in the United States will consume in his or her lifetime more than 200 times the energy resources as will a baby born in Bangladesh.
While the spatial pattern of consumption is strongly skewed toward the developed world, the environmental impact of the consumption is spread more broadly. Many natural resources used to manufacture goods are extracted and processed in semiperiphery countries and then consumed in core countries. Consequently, the problems with mining and manufacturing plague poor countries. For example, mining is among the most dangerous jobs in the world, and manufacturing is responsible for significant air pollution. However, problems with using products, such as waste disposal, are more common in wealthy countries.
Income Distribution
While per capita measures of wealth are useful for comparing countries, they do not reflect the distribution of wealth. South Africa and Paraguay have similar levels of GDP per capita but very different distributions of wealth. Paraguay has a much higher percentage of middle-income people, while South Africa has more people who are either very wealthy or very poor. One measure of the distribution of income within a population is the Gini coefficient, sometimes called the Gini index. The values range between 0 and 1. The higher the number, the higher the degree of income inequality. A Gini coefficient of 0 would mean the population had no inequality—everyone’s income was exactly the same. A Gini coefficient of 1 would indicate total inequality—one person had all the income in a population and everyone else had none.
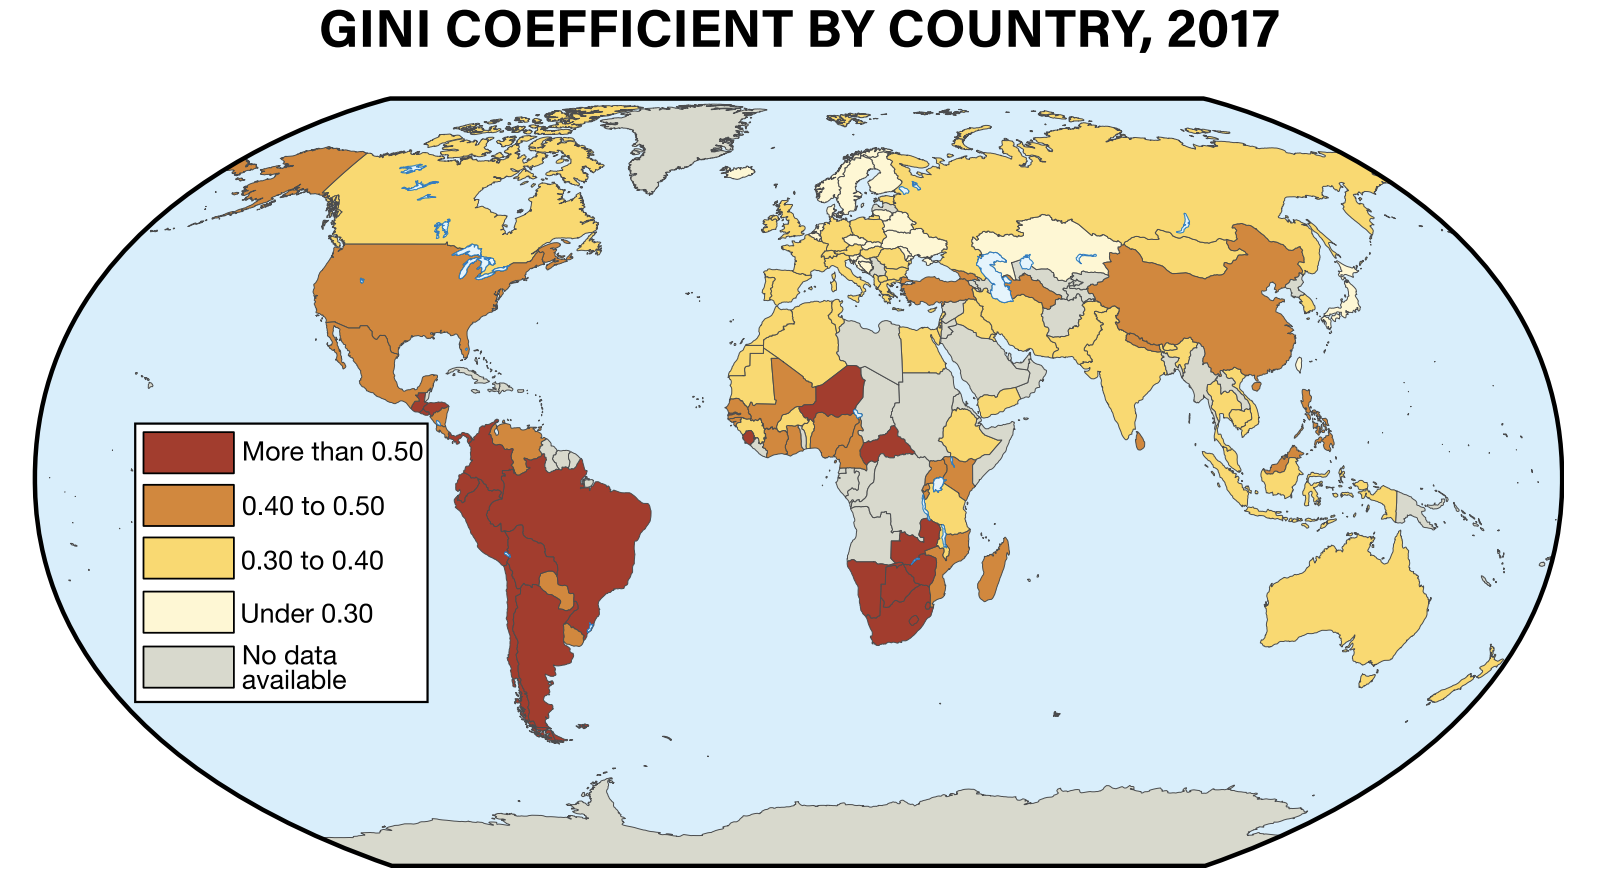
In general, periphery and semiperiphery countries have higher Gini coefficients than do core countries. Often, this reflects the small number of middle-income people in a periphery and semiperiphery country.
Patterns of Economic Development
The spatial pattern of inequality reflects more general patterns of economic development. At a global scale, some regions are wealthier than others.
Africa and South America
Many African states have growing economies, but average incomes remain low compared with more-developed countries. South America has both middle- and low-income countries. These continents account for about 20 percent of the world population but only about 8 percent of global GDP.
Asia
The largest income gains in the past five decades have been in Asia. First Japan, and then South Korea, Hong Kong, and Singapore, adopted policies of strong government support for education and business, which promoted prosperity. More recently, China and India have shown impressive economic developments. Asia accounts for about 60 percent of the world population and about 37 percent of global GDP.
North America and Europe
These regions have been relatively prosperous over the past century. With about 16 percent of the world population, they produce about 55 percent of global GDP. Western Europe and the United States have been the wealthiest parts of this region. Central America is mostly middle income with Mexico and Costa Rica becoming more prosperous.
Uneven Development at the Regional Scale
Development can be very uneven within countries. In general, rural or peripheral regions of a country are often less developed than core urban areas. In China, the three wealthiest provinces are along the heavily urbanized Pacific Coast, while the poorest provinces are all in the heavily rural western region.
Social Measures of Development
Relying on just one statistic, or “single numberitis,” is not a reliable way to understand a country’s level of development. Several noneconomic factors also reflect development.
- The total fertility rate is the number of babies a woman is expected to have in her lifetime. It shows a negative or inverse correlation with wealth and development. That is, as income and development goes up, total fertility typically declines.
- The infant mortality rate is the rate at which babies die before the age of one. It also has an inverse correlation with development.
- Life expectancy, the number of years a person is expected to live, has a positive correlation with development. Life expectancy is also related to the availability of adequate health care. Poor countries that have invested in health care have increased their life expectancy.
- The literacy rate is the percentage of the population that can read and write, usually at an 8th-grade level or higher. In 2015, it topped 90 percent of the world population and 99 percent in highly developed countries. Most who were not literate were females living in less-developed countries.
The Gender Gap
Differences in the privileges afforded to males and females in a society are the gender gap. The size of the gender gap varies tremendously among countries. These differences might appear in educational opportunities, employment options, wages, voting rights, health care, political empowerment, property rights, the ability to drive a car, inheritance rights, or the right to make contraceptive decisions.
Gender Inequality Index (GII)
Since 2010, UN’s Human Development Report has reported on the Gender Inequality Index (GII), a composite measure of several factors indicating gender disparity:
- Reproductive health, which includes maternal mortality rates (death of a mother during birth) and adolescent (under 19 years old) fertility rates
- Empowerment, which includes the share of government seats held by each gender and the proportion of adult females and males with at least some secondary education
- Labor market participation, which includes the labor force participation rate of female and male populations aged 15 years and older
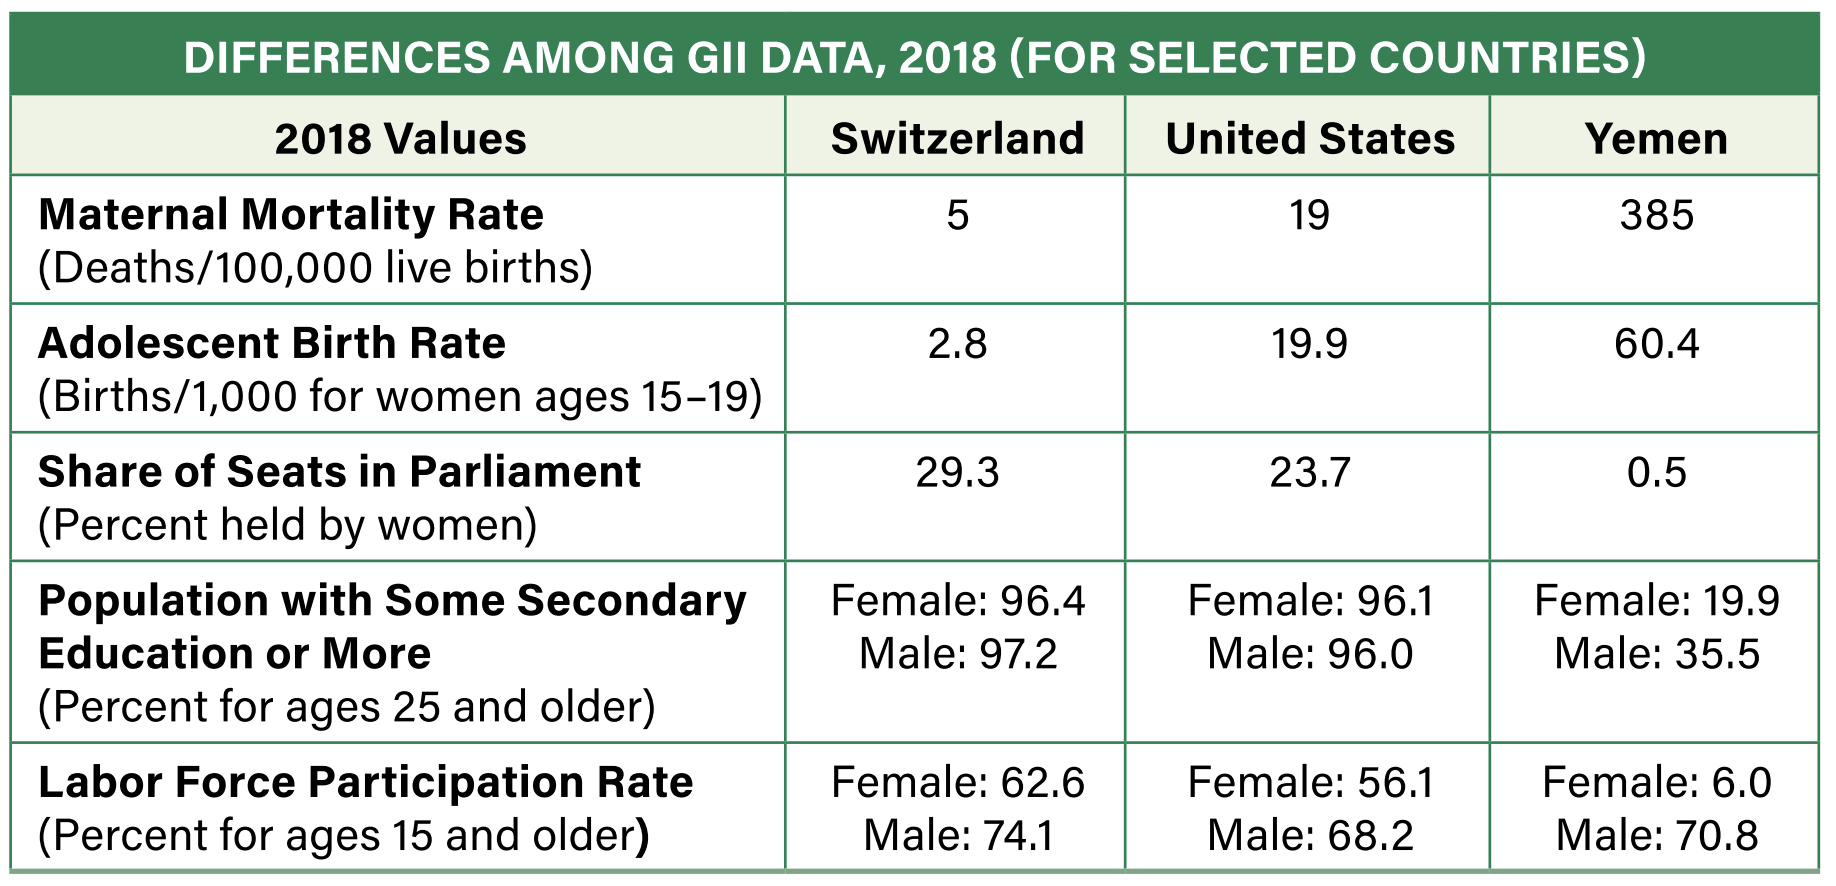
The composite score is a measure of the percentage of potential human development lost due to gender inequality. The table below shows the GII for Switzerland, the United States, and Yemen. The GII for Switzerland indicates that the country lost only 2.5 percent of its potential human development as a result of gender inequality in 2019, while Yemen lost 79.5 percent.

A closer examination of data used to determine the GII for Switzerland, the United States, and Yemen reveals the discrepancies among the variables-shown in the table on the next page. Of particular significance are the share of seats in parliament and labor participation value. Women in Yemen are severely underrepresented in their governments, as well as in the labor force.
The Human Development Index (HDI)
The Human Development Index (HDI) combines one economic measure (GNI per capita) with three social measures (life expectancy, expected years of schooling, and average years of schooling). The composite score for each country will range between 0 and 1, with the higher values representing greater levels of development.
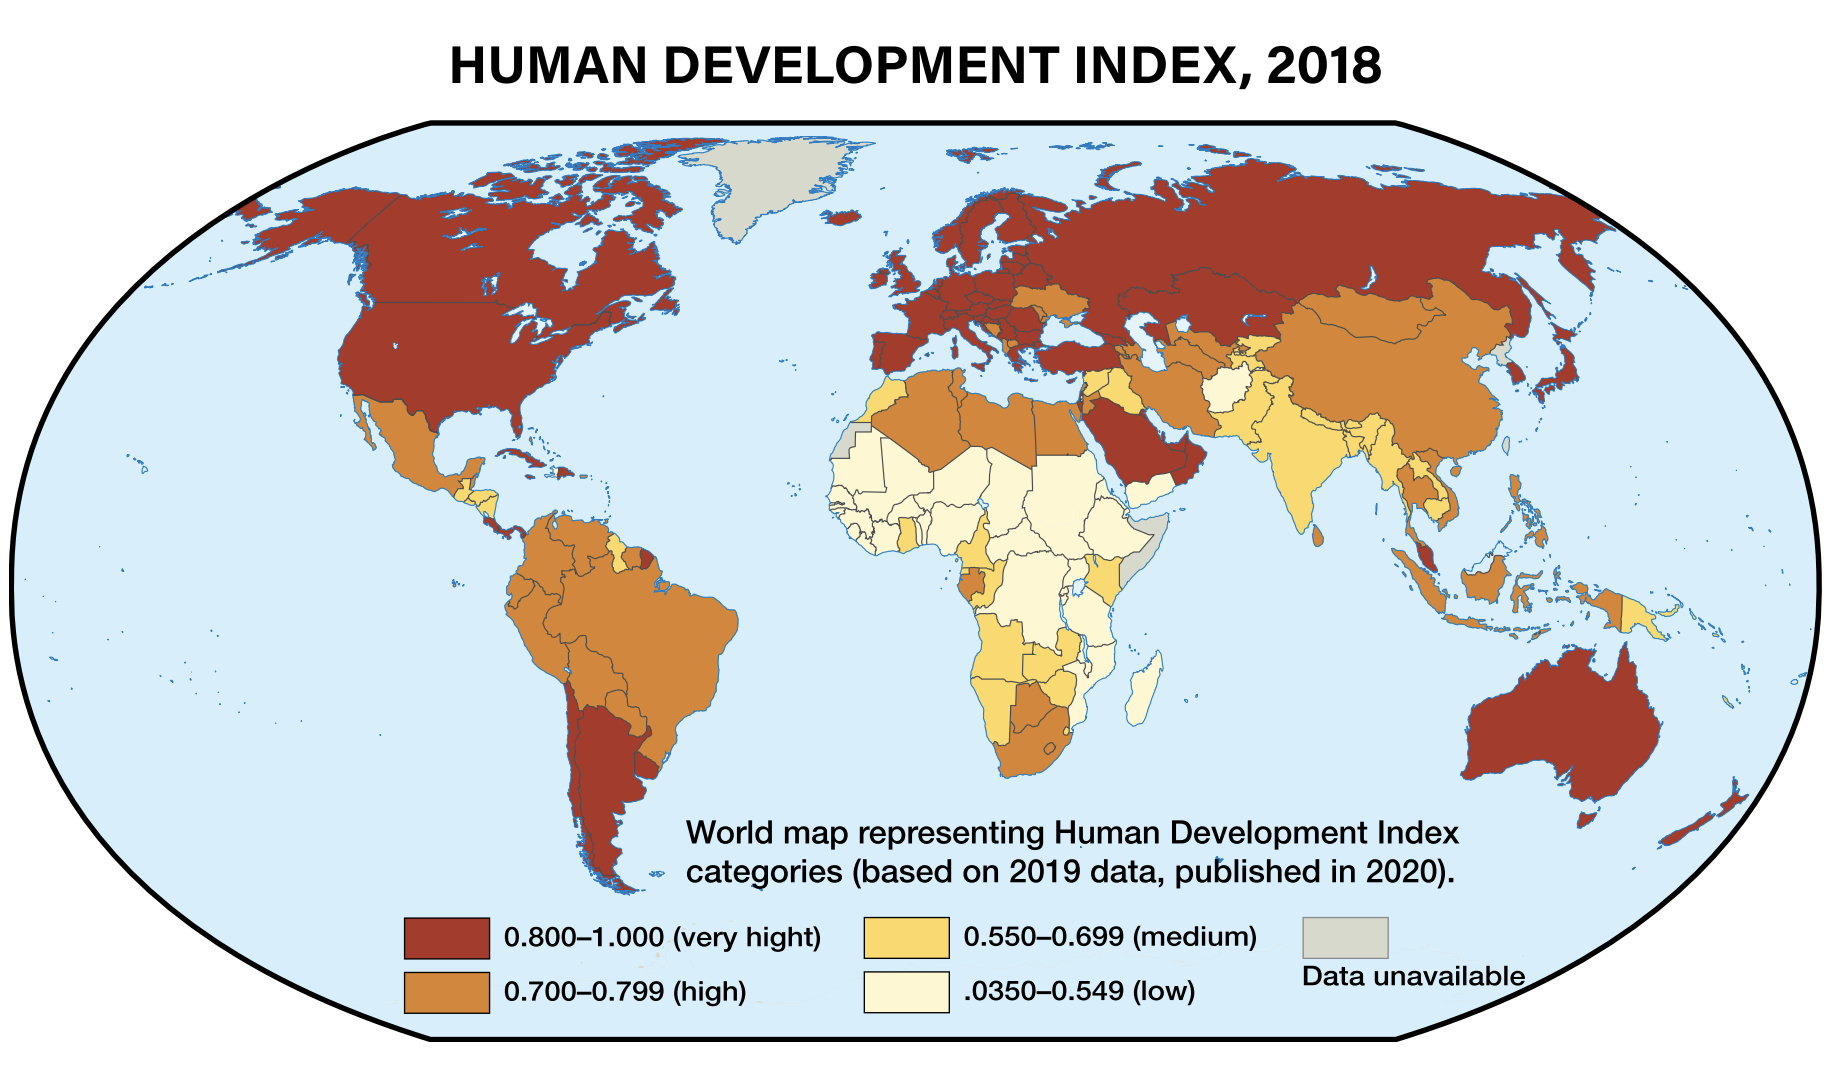
While most countries rank similarly on GNI per capita and HDI, some rank quite differently.
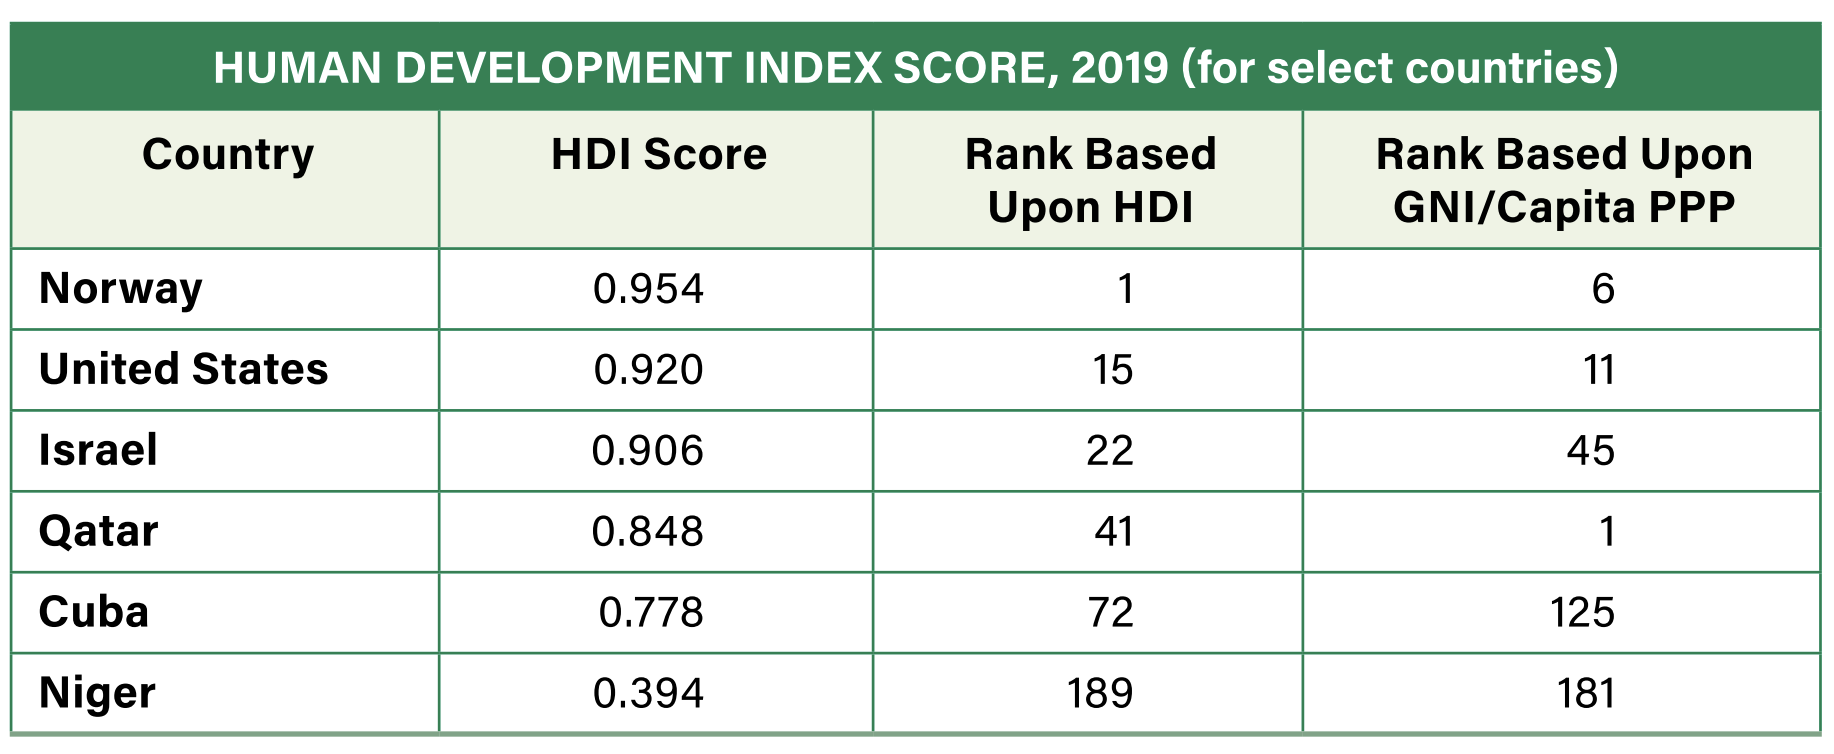
In the table above, notice the differences between the rankings for GNI/ capita PPP and HDI for the six countries:
- The rankings of countries by HDI and income are often similar (Norway and the United States). Norway ranks Is in HDI and 6th in income.
- Some that invest heavily in education and medical care rank higher in
HDI than in income (Israel and Cuba). Israel ranks 22nd in HDI but only 45th in income. - Some countries that are rich in oil or other natural resources rank higher in income than in HDI. Qatar ranks first in the world in income, but only 41° in HDI.
