
Population Distribution Factors
physical
human
environmental determinism
How does population density affect:
political
economic
social
services/infrastructure
environmental
Population Density Types
arithmetic
physiological
agricultural
Population Concepts
carrying capacity

Global Population
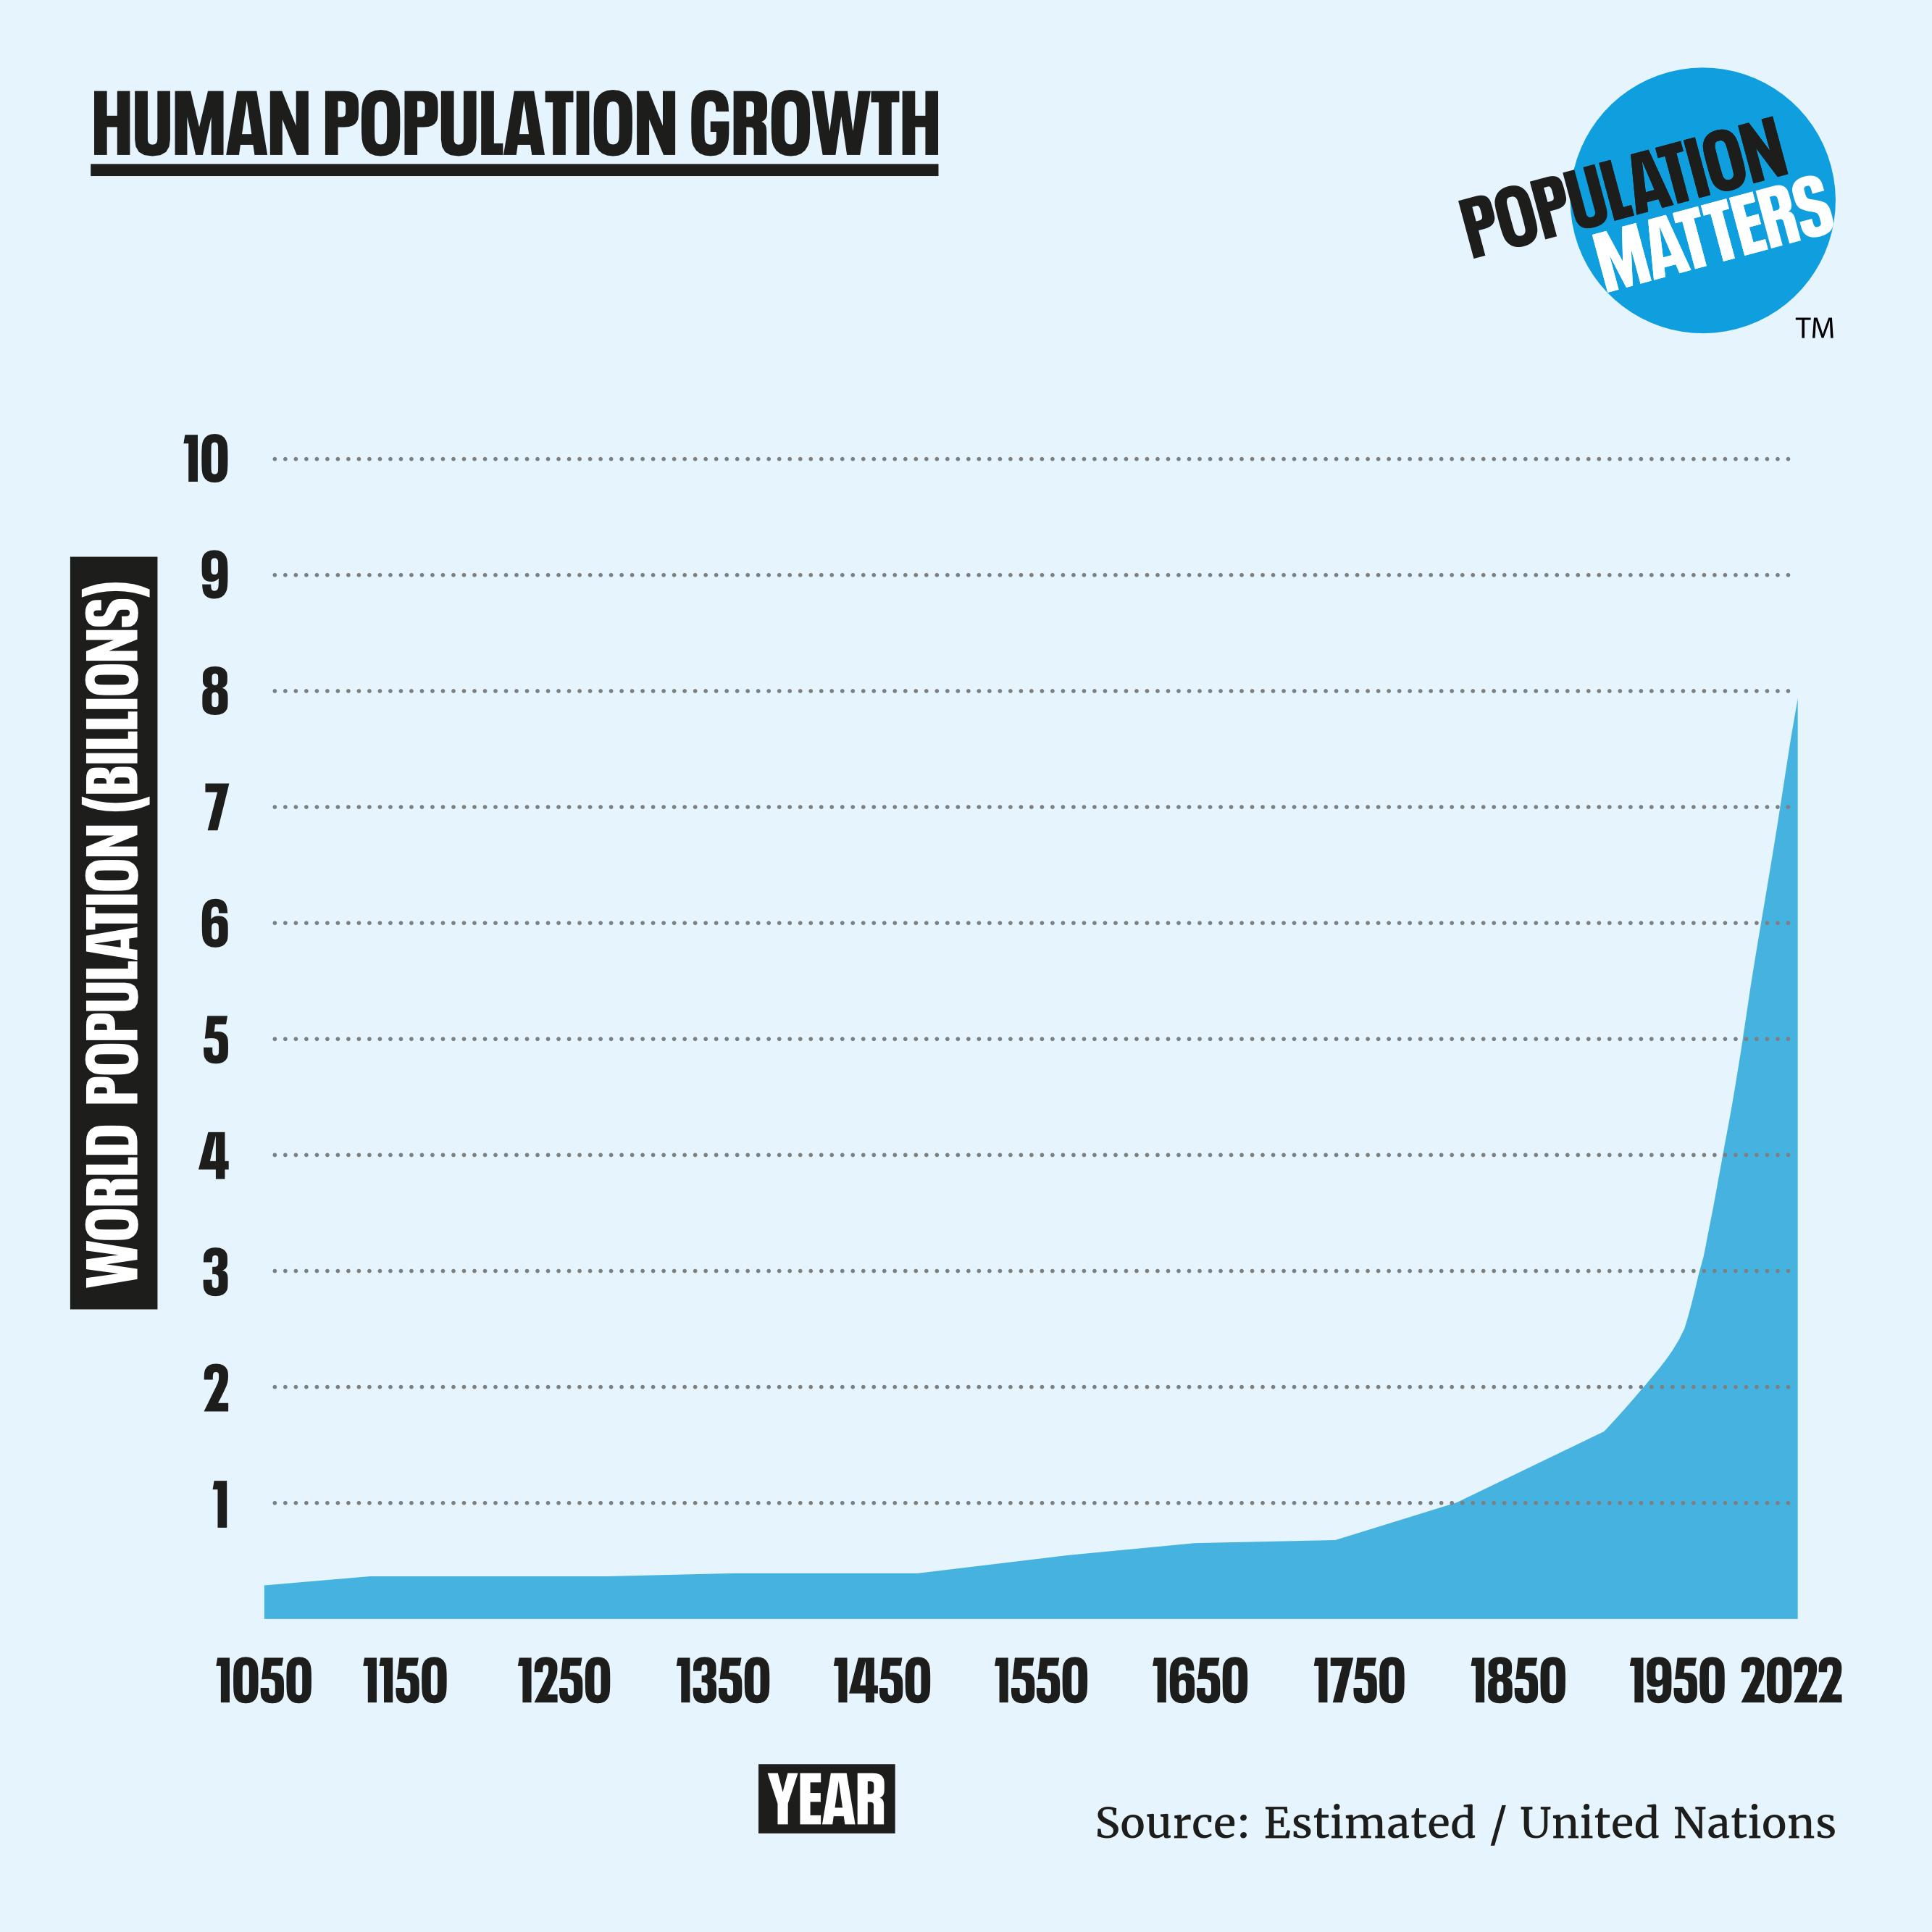
Are we overpopulated? Check out this graph that shows human population growth in billions since the year 1050.
Most people see this for the first time and say, yeah we are definitely overpopulated. And if that’s how you answered, my favorite character from The Office would agree with you.
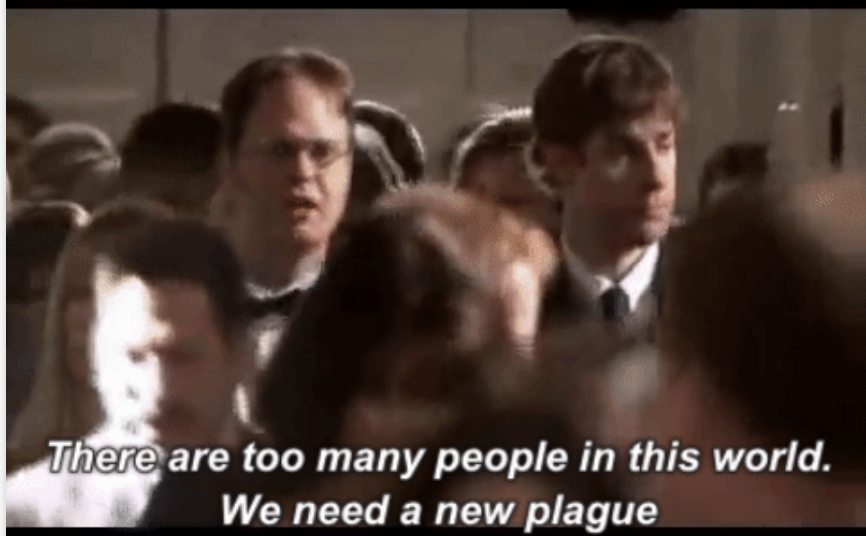
I guess that pre-covid scene didn’t age very well though, did it!?
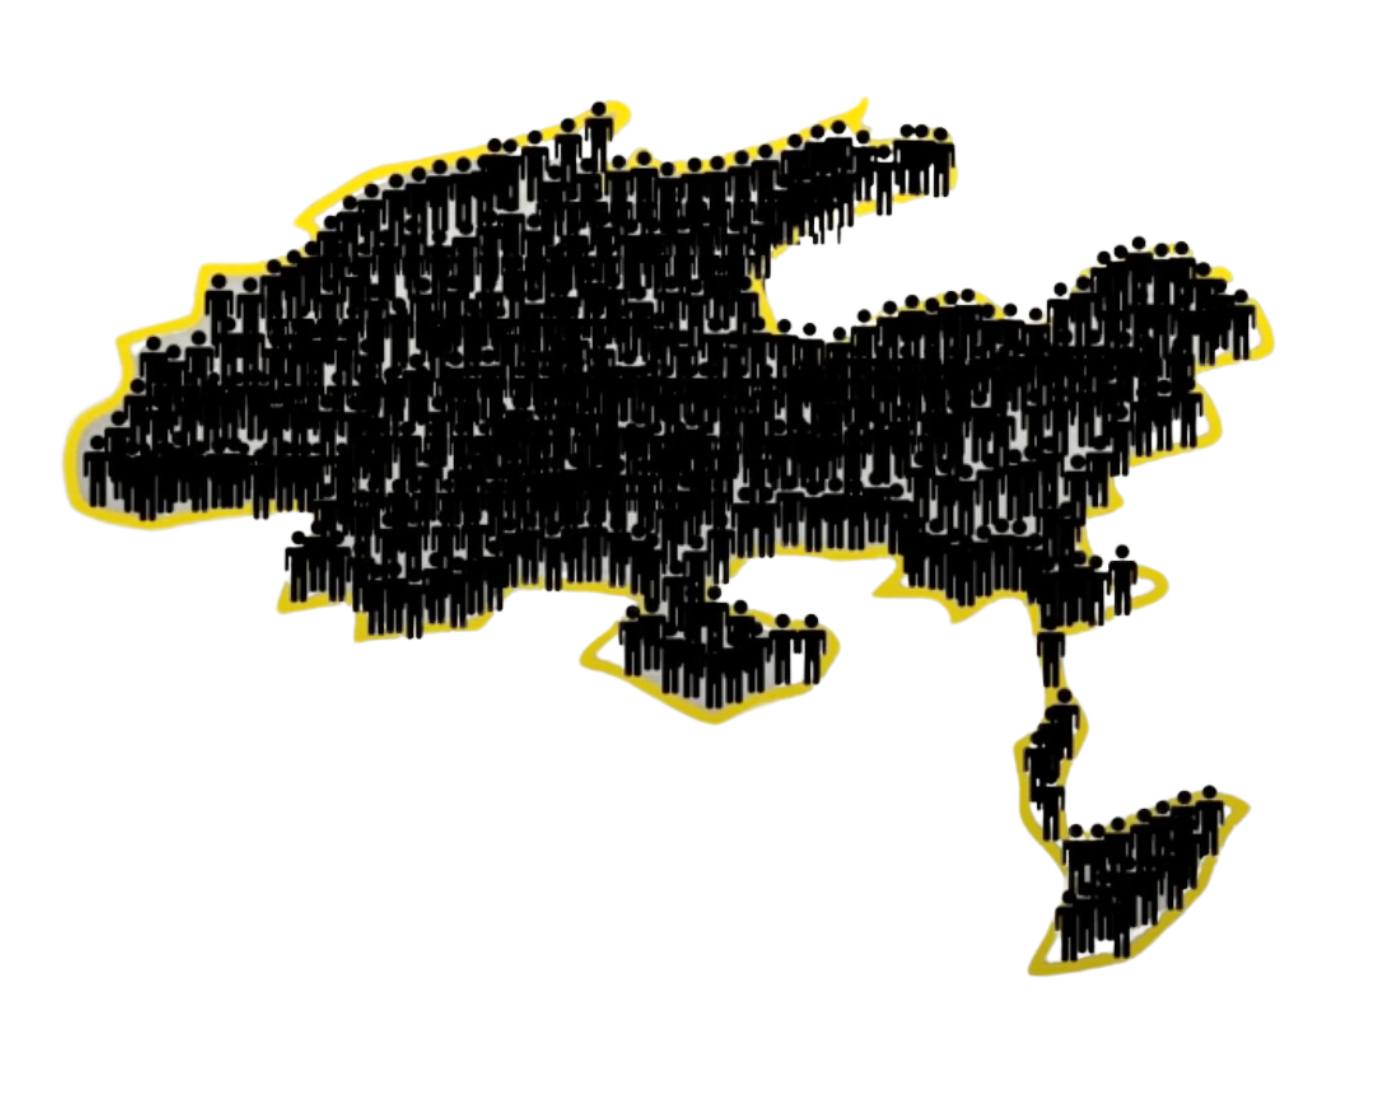
Here’s where things get complicated though. There are about 8 billion people alive today. And if all 8 billion of us were standing next to one another, we would all fit within the city limits of Los Angeles.
Now, granted LA extends over a very large geographic area, but if you zoomed out and looked down from space, this is what all 8 billon of us would look. It’s so small I used that red arrow to indicate the yellow spot, and if I zoomed out any more you wouldn’t be able to see it at all.
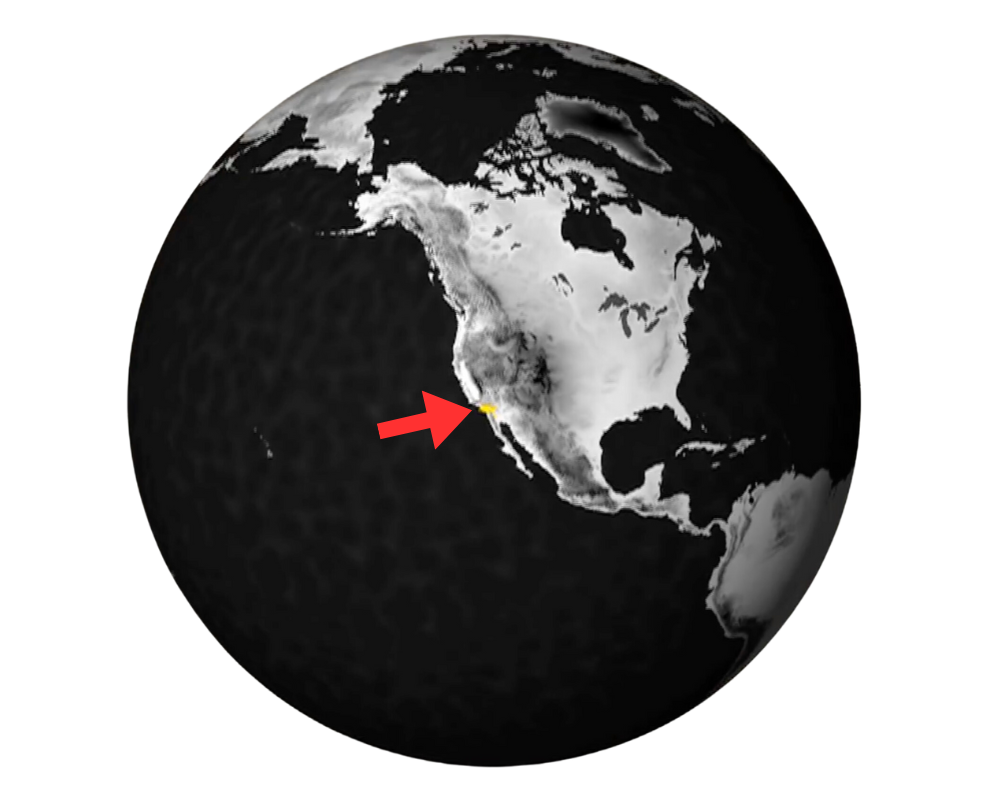
So, from this scale of analysis, it becomes difficult to be as sure we are overpopulated. To make it even more complicated, when we switch to a national scale of analysis and also consider population growth rates, we can see that some countries are growing rapidly, some aren’t really growing much at all, and we now have countries that are shrinking in population. So what makes it so complicated, and what can we learn about the world from taking a closer look at population density and how it affects people, places, and the environment?
Let’s start by asking the simple question: Where do all these people live, and why do they live there?
We can break this down into two categories: site factors and situation factors.
site factors
As you can see from the dot density map above, most population centers settle along bodies of water, the most obvious being coastlines. We know from living in Santa Cruz County that humans prefer to live in mild climates. Extreme temperatures, either too hot or cold, make it difficult to survive and difficult to produce food. Humans settle in areas where the soil is fertile, and crops will grow, and we tend to avoid high elevations where climates are colder, and crops will not survive.
situational factors
Humans need access to nearby freshwater sources, like rivers or aquifers. Rivers and coastlines provide transportation networks (especially before airplanes and automobiles). We also tend to live near economic opportunities and centers where we can access goods and services.
This helps us understand that overpopulation isn’t necessarily related to available land and might have more to do with livable land. But I’m about to make that more complicated, too.
Population Density
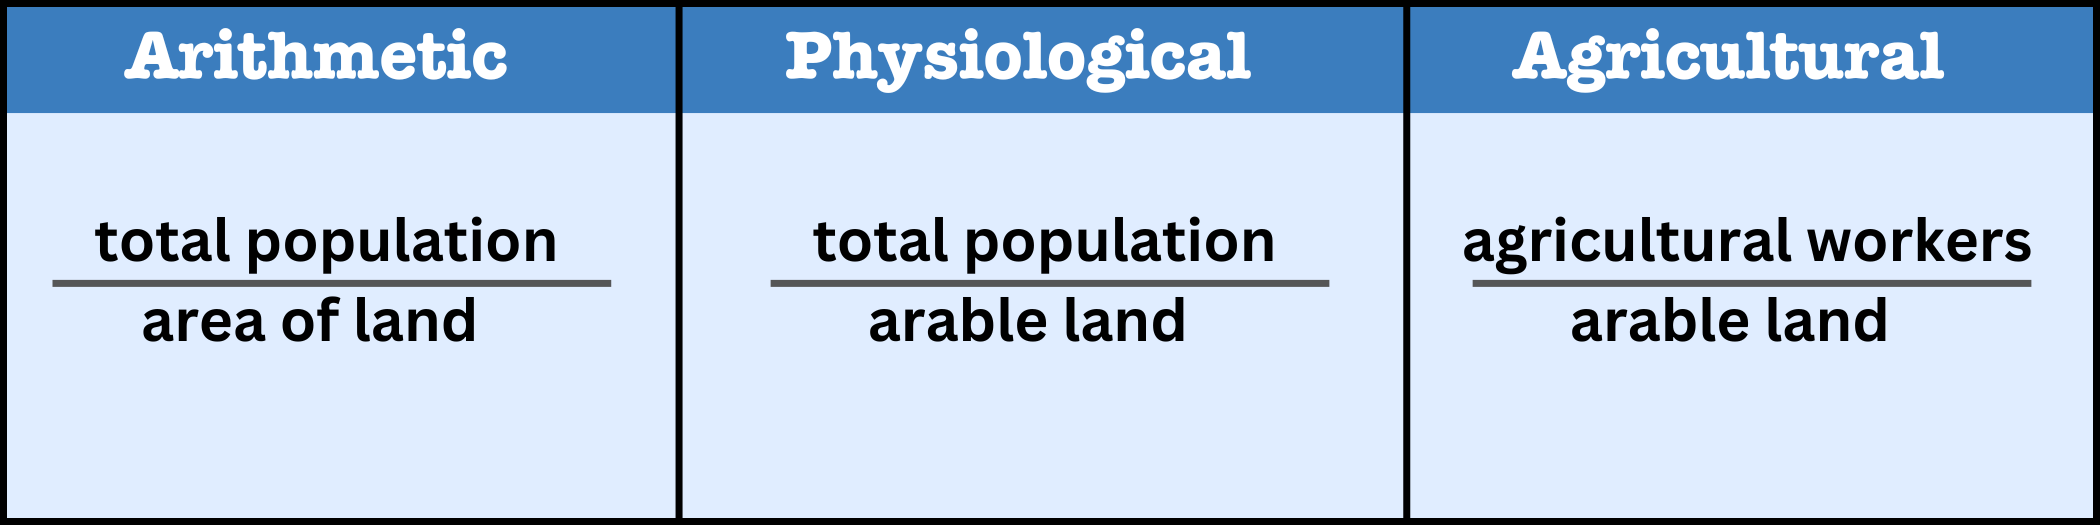
Population density, in its simplest form, is the number of people living within a specific area of landmass. We call that arithmetic density. But as we just learned, total people divided by total land doesn’t necessarily indicate overpopulation. So we have two more densities we can look at.
Physiological density shows us a country’s population divided by the amount of land capable of producing food (called arable land). This gets a little closer to answering our question about overpopulation. This type of density helps us understand how capable a country is of producing enough food to feed its population. If the physiological density is high, it reveals that a country is putting quite a bit of stress on its land and might run into sustainability issues. (Which sounds like overpopulation).
Agricultural density indicates how many people work in agriculture, divided by arable land. A high number shows that a country has a large percentage of its population working in the agricultural sector. A low number, obviously, shows the opposite.
Density Insights
So that’s the definition stuff. But that’s not the interesting part, so now that you understand what it means, let’s look at how it helps us understand the world.
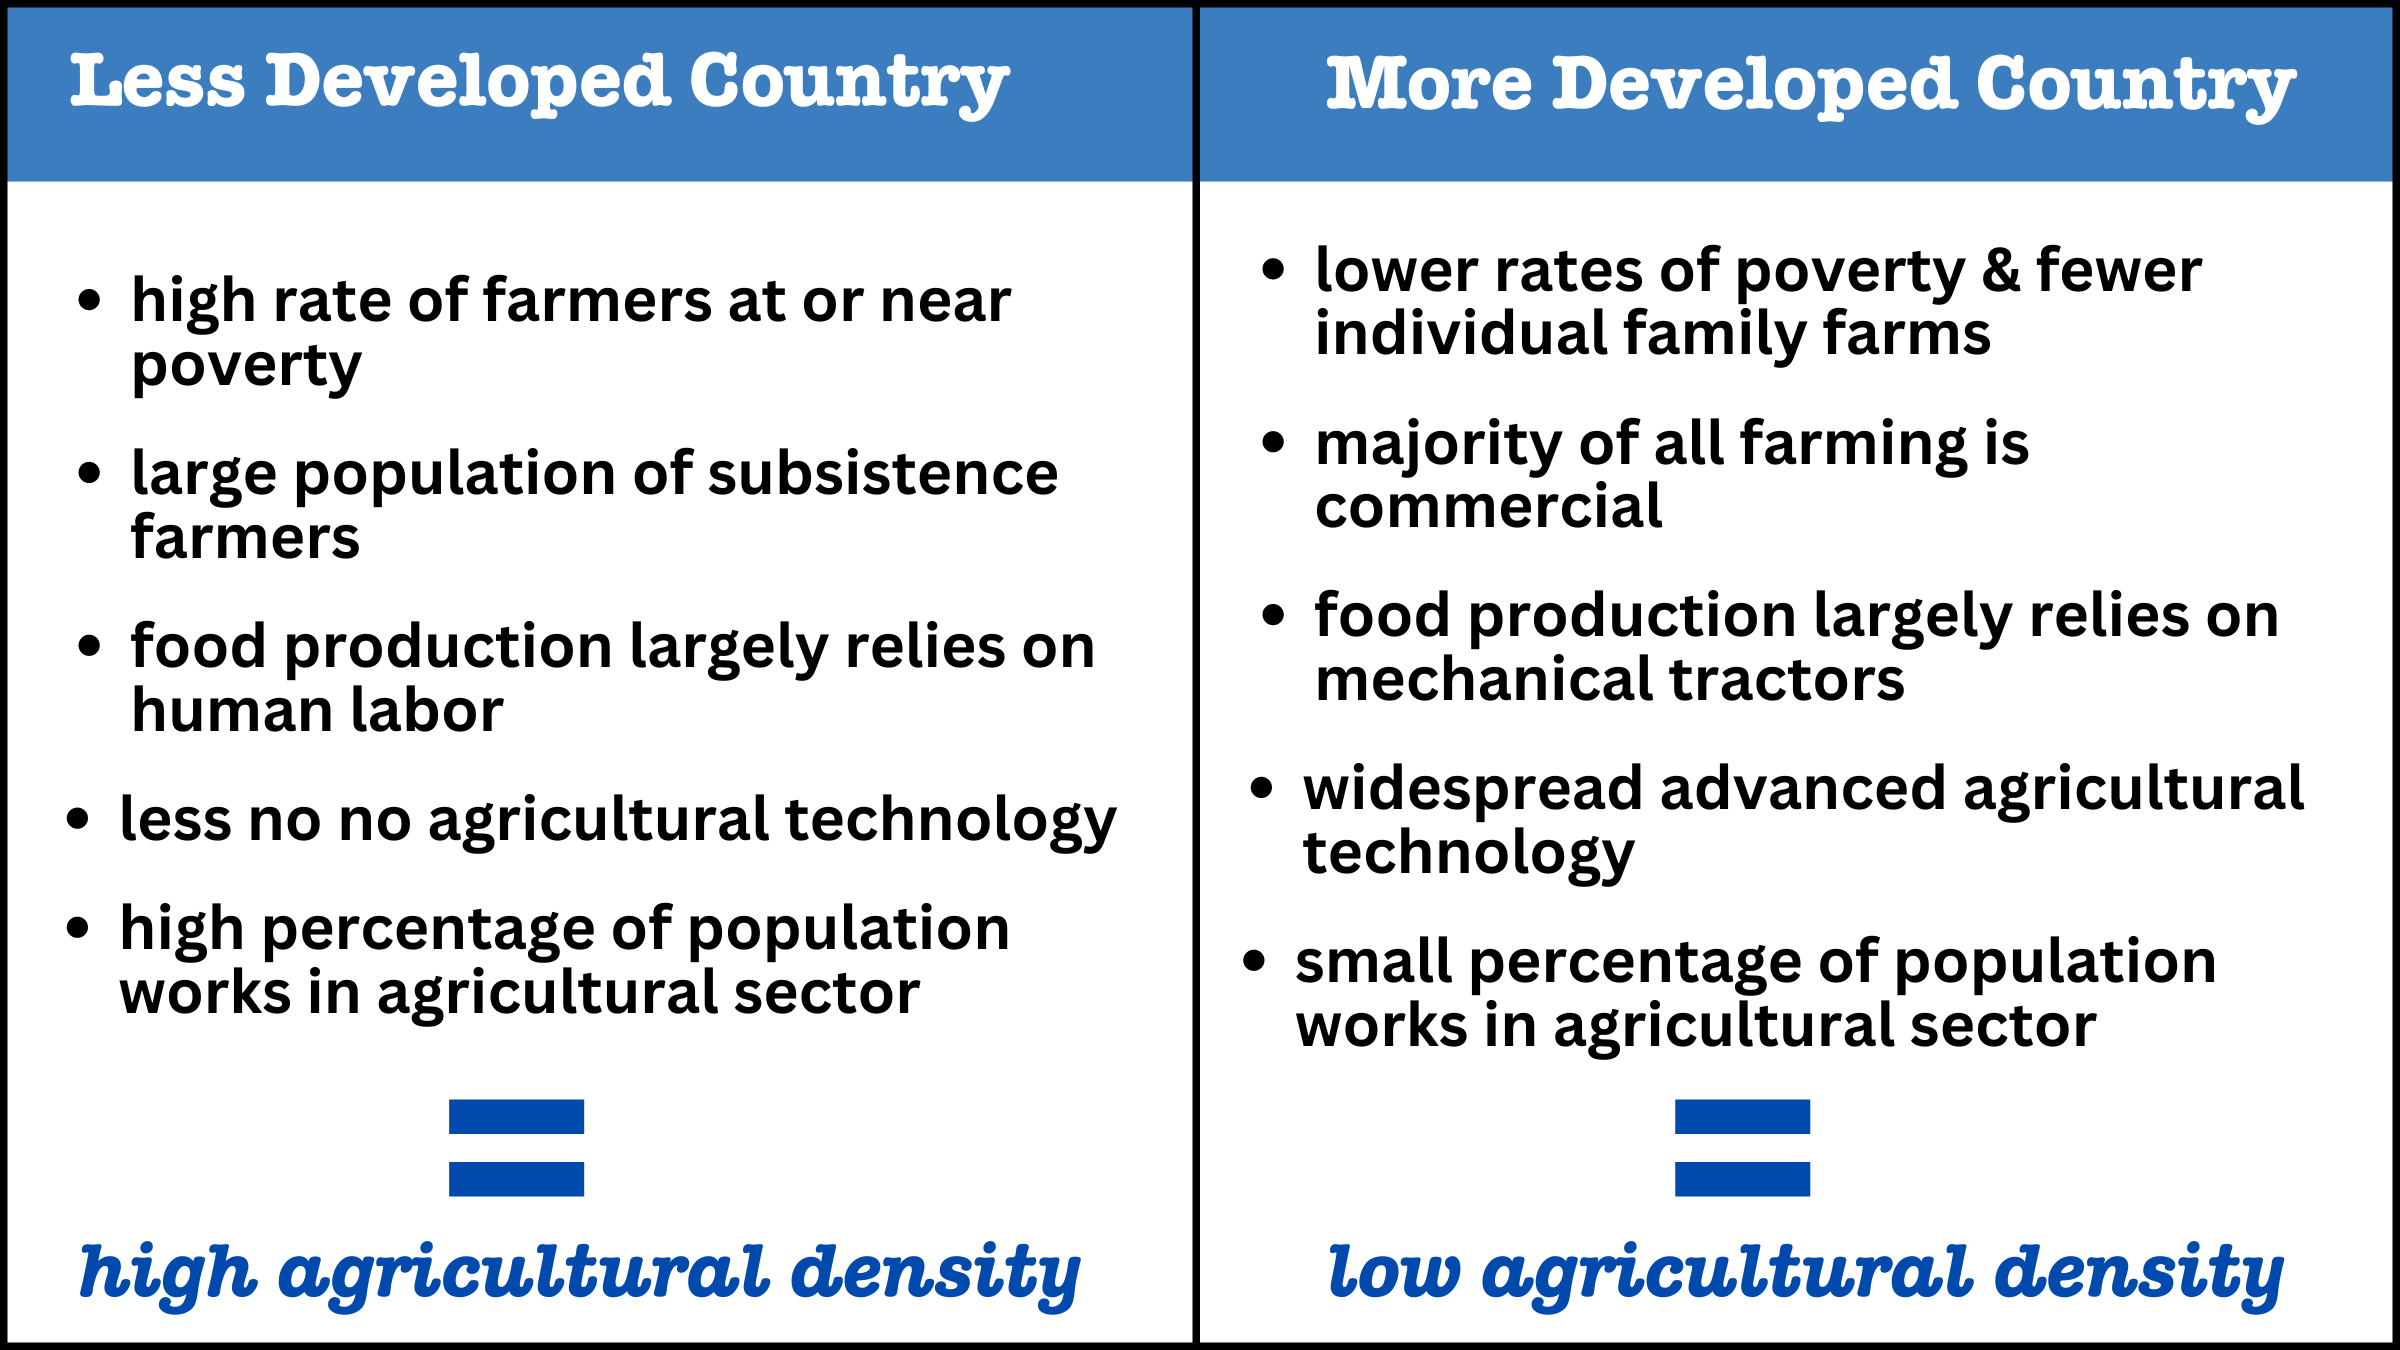
When physiological density and agricultural density is high, it indicates that the country might be having trouble producing enough food on its own. This might mean they need to import food from another country or rely on food aid.
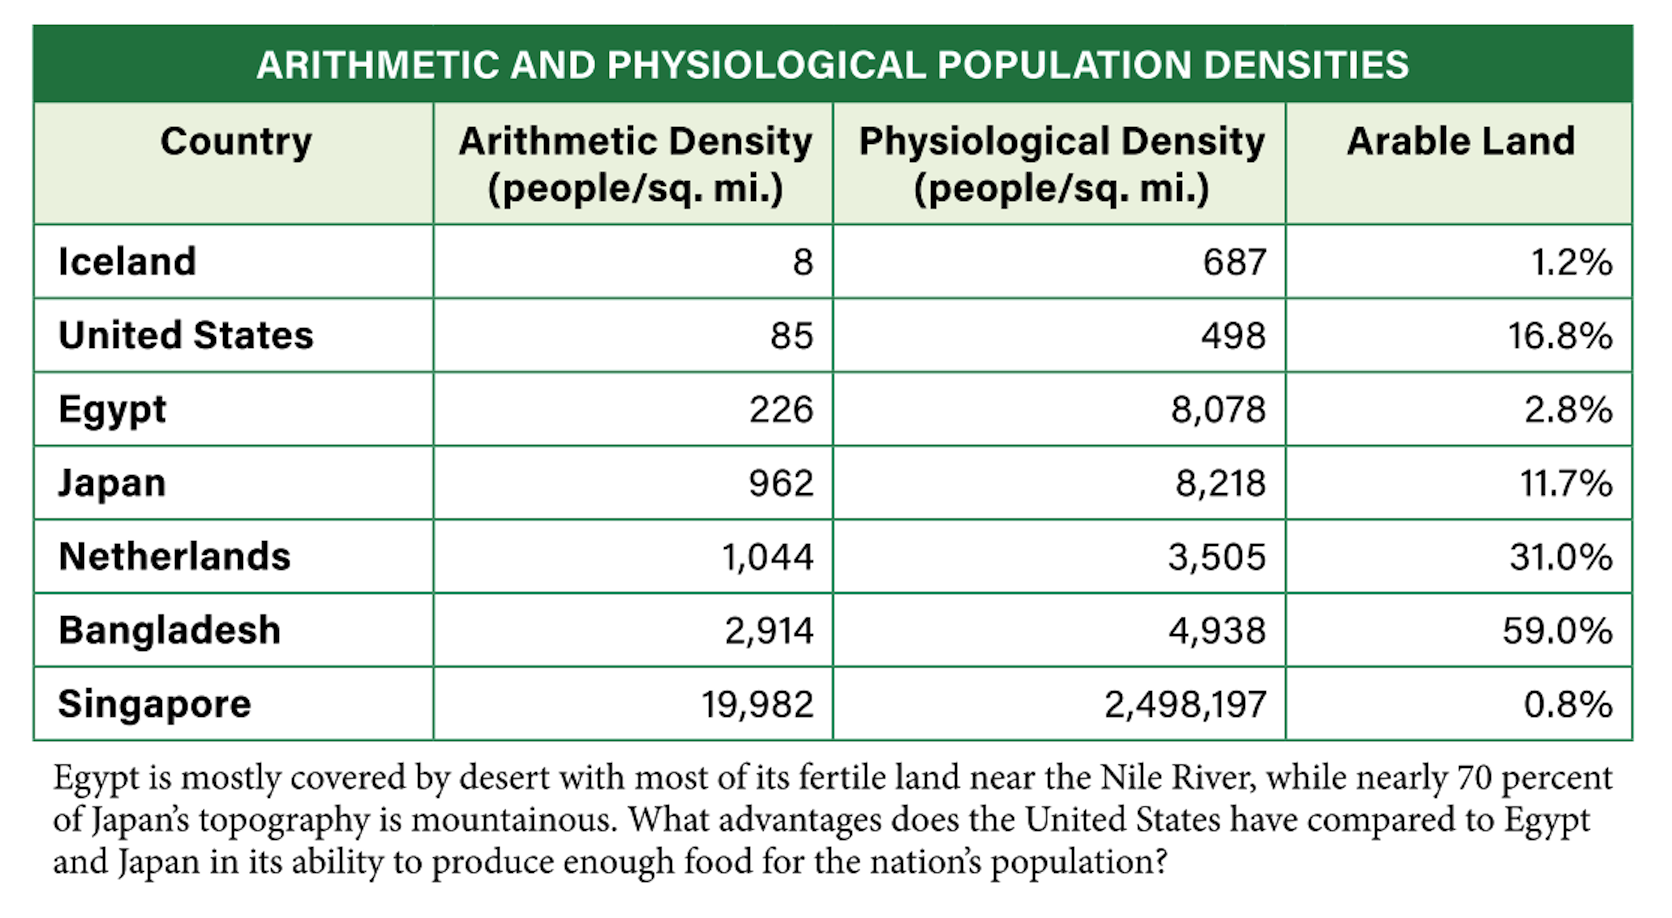
Analyzing population densities can also reveal a country’s level of economic development. This can get confusing, so instead of teaching you how a high or low density reveals economic development, it might be easier to learn it backward. Study the table below.
So here’s another tool to add to your toolbox for understanding the world. We can analyze a comparison of a country’s 3 population densities and draw conclusions about a country’s ability to produce food, and draw insight into its level of economic development.
Here’s where it gets really cool. If we have insight into a country’s level of economic development, we can also draw conclusions about its access to education, healthcare, and economic opportunities.
Carrying Capacity
We still have not answered our question, though. Are we overpopulated, and how do we define what it means to be overpopulated?
Is a country overpopulated if its agricultural density is too high? Maybe, but that can get complicated too.
A country’s carrying capacity is the number of people it can support without depleting its resources for the next generation. Here’s why that’s tricky: Humans do not consume resources evenly. Some populations consume 10 times the resources as others.
According to the Australian Academy of Science, if the Earth’s population consumed the average resources of a typical American, the Earth could only support 2 billion people. That’s a problem. As countries continue to develop and poverty rates worldwide continue to decline, the demand for resources is expected to increase.
That suggests the answer to our question is yes. But as we’ll see in this unit, in the 1960s, the world tried to slow and reverse population growth—when the population was around 3 billion people (according to my Alexa, which I just asked). And some pretty nasty stuff happened.
But the issue isn’t the number of people. It’s resource use. By the end of this century (the year 2100) the global population is expected to be 10 to 11 billion. Demographers predict that it will peak around that time and will not continue to increase. Population growth is expected to remain flat, and may even begin a slow and steady decline. The issue we need to address over the next 80 years is finding ways to use resources efficiently so that we can sustain 11 billion. Scientists believe it’s possible, but not with the slow pace of change we are seeing today.
Population Density Disparities
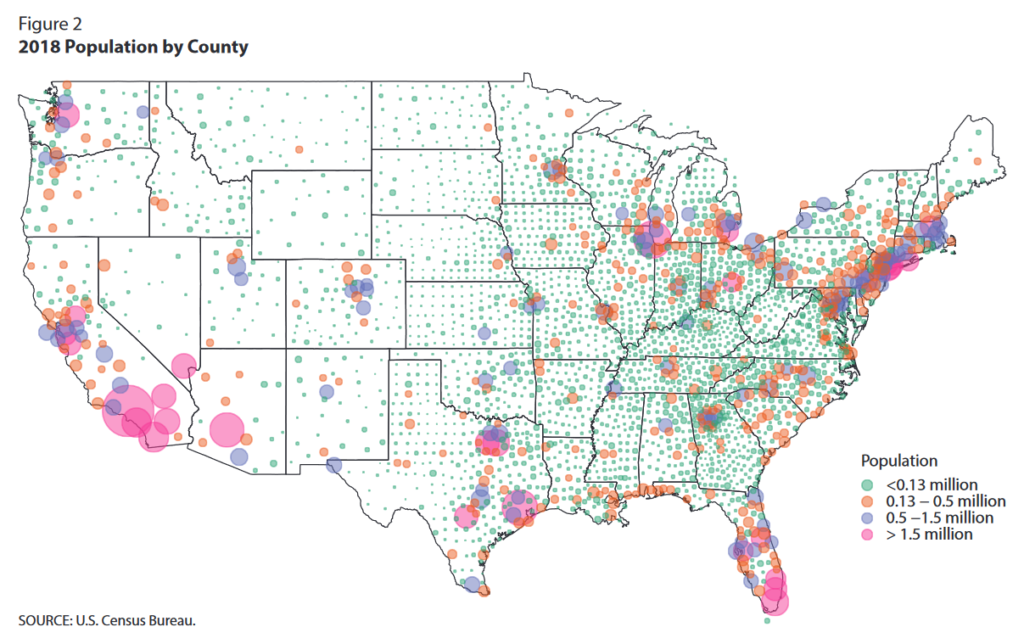
A country as large as the United States does not have an equally dispersed population. Given what you learned at the beginning of this chapter, it should make sense. People live along coastlines and bodies of water. So most of our population lives on the West Coast (California, Oregon, Washington), along the East Coast, and in the Midwest (along either side of the Mississippi River).

A population disparity refers to imbalances between a rural population, smaller populations dispersed over larger areas, and urban populations, densely populated cities. These imbalances help us understand what’s driving the deep political division we’re experiencing in our country. You might have heard this described as the rural-urban divide.
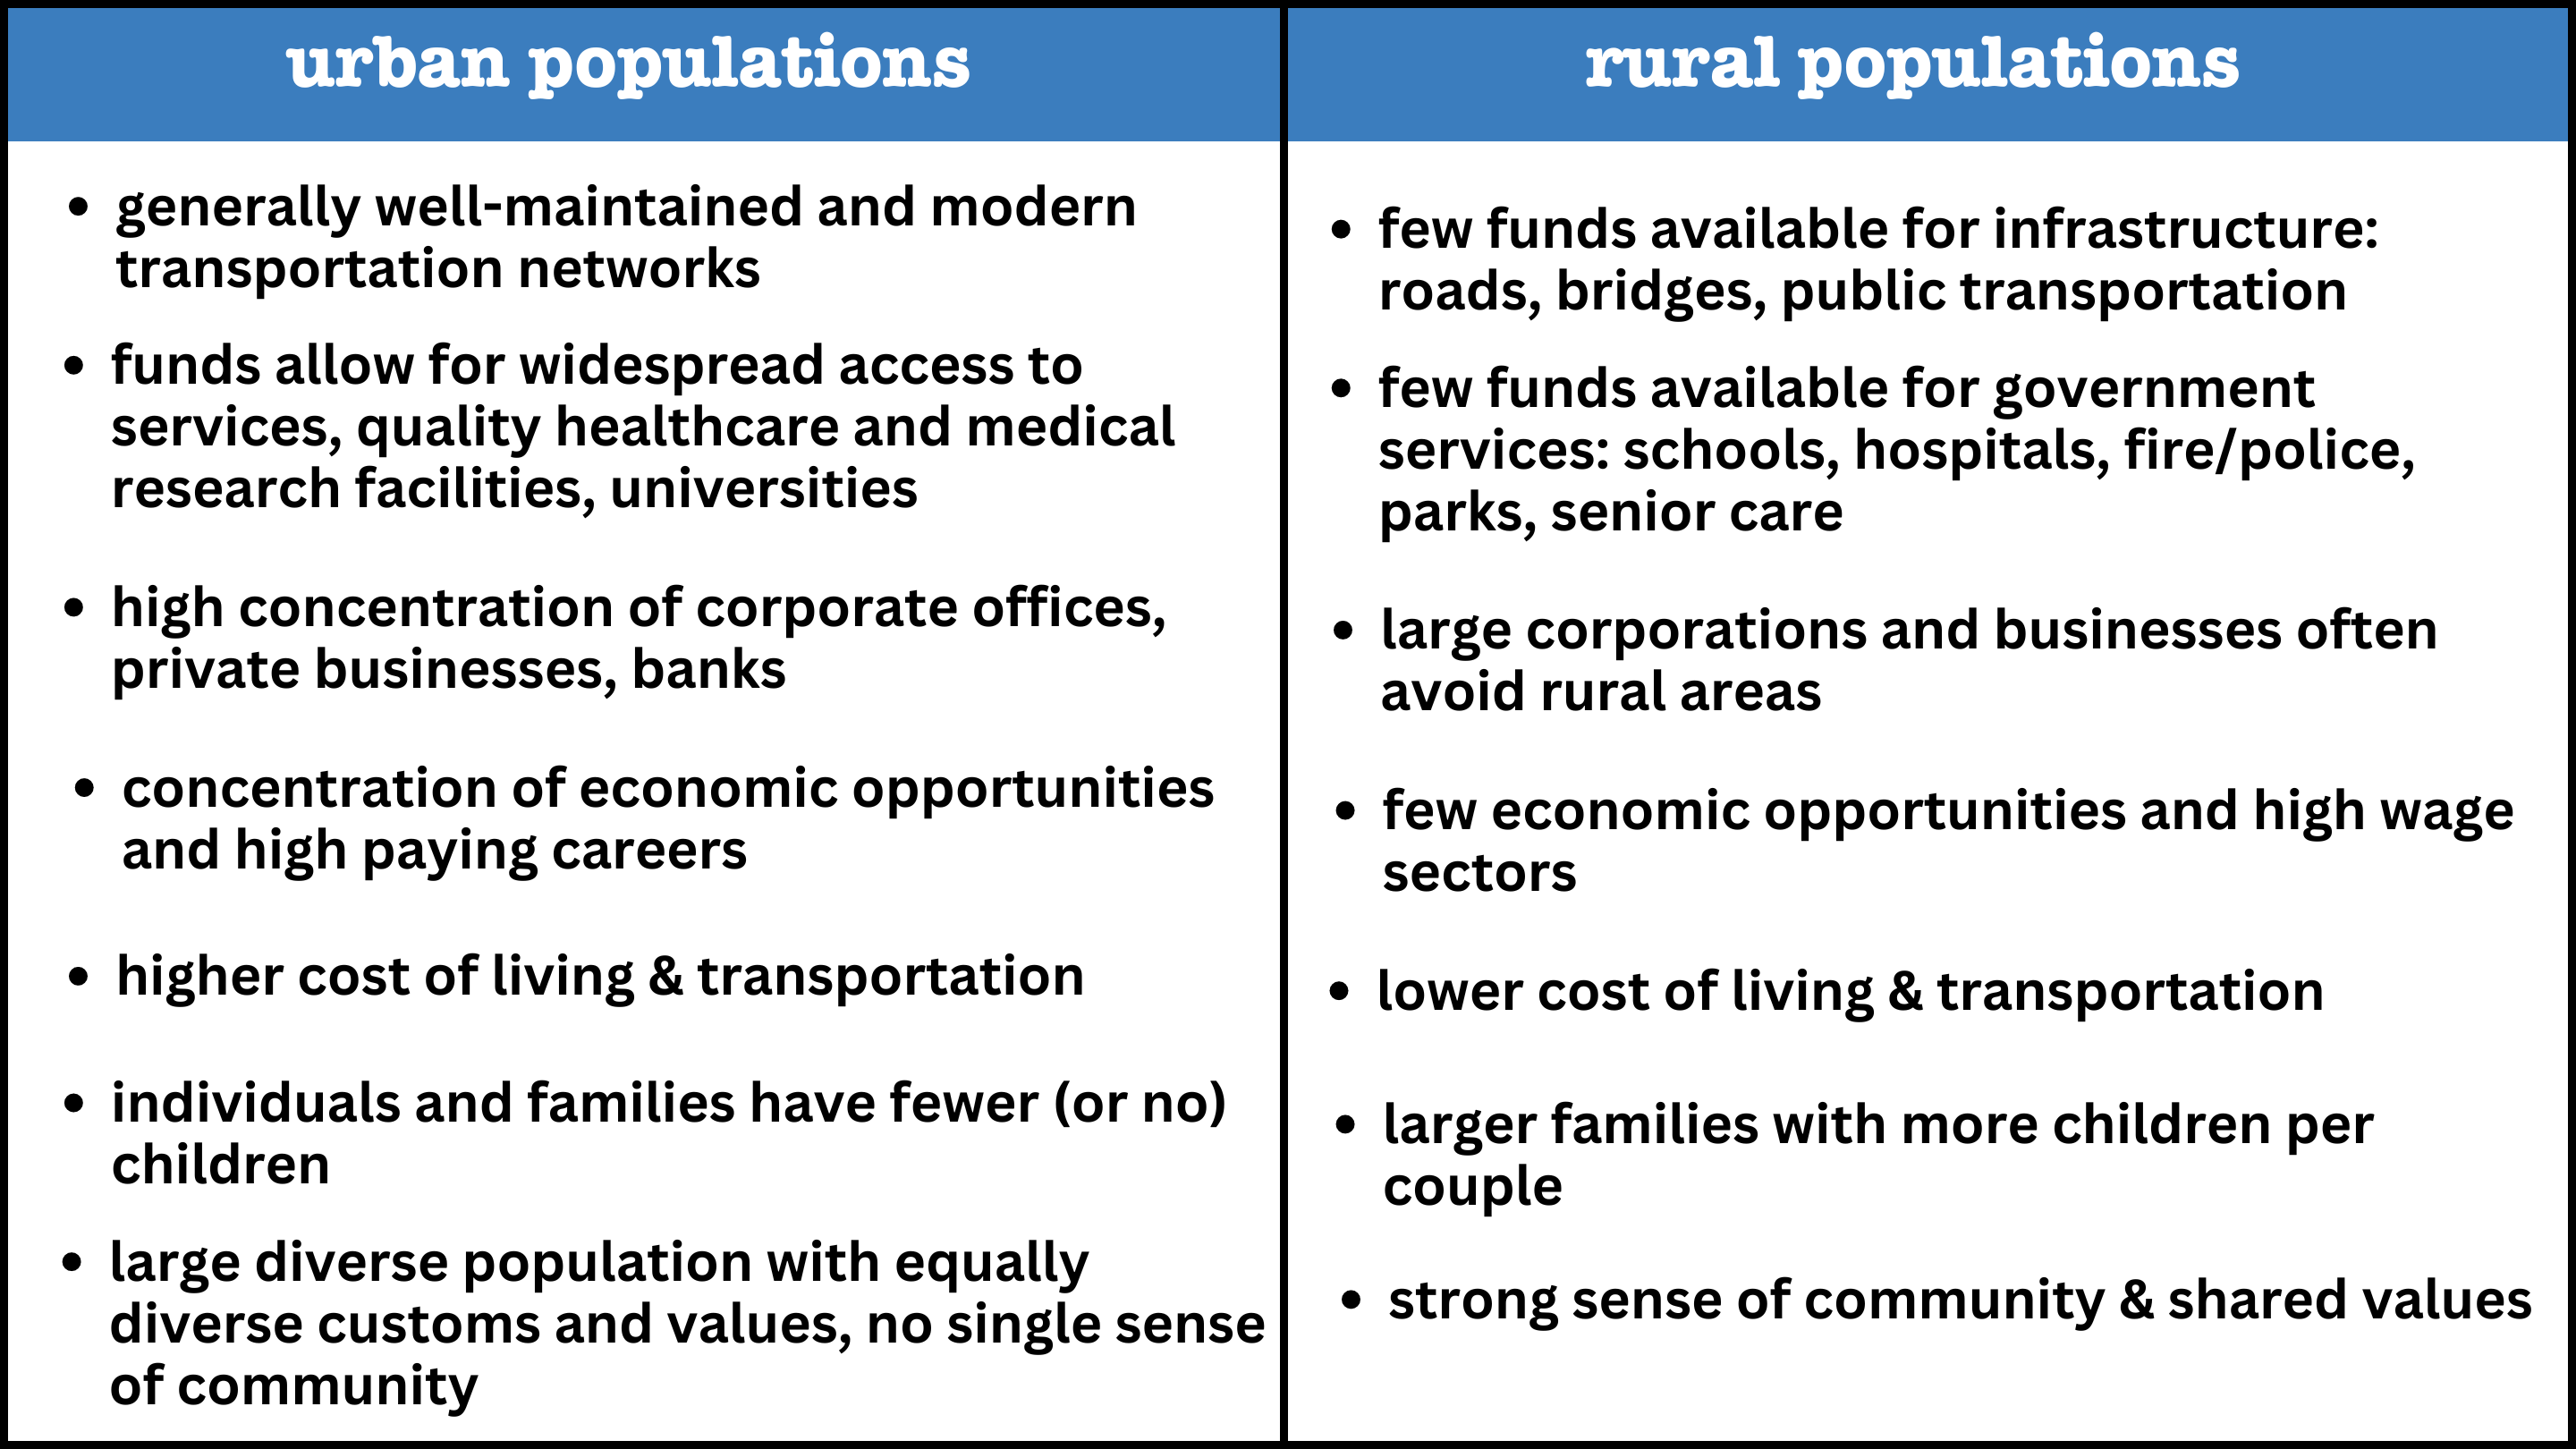
Dense urban populations can afford higher-quality transportation networks like modern roads, bridges, and communication infrastructure. Economic opportunities tend to concentrate among densely populated areas with a large pool of skilled and qualified workers.
Rural areas may lack access to hospitals equipped with surgical and trauma centers, requiring long travel to a nearby city. Rural areas usually lack universities and vocational centers that provide ways for individuals to learn new skills for a changing economy.
Although the cost of living may be lower in rural areas, average wages and salaries are also lower, and most jobs are laborious service jobs.
Much of our current political division stems from these disparities. With more economic opportunities in urban areas, people tend to value individual accomplishments and careers. On the other hand, rural populations tend to focus on more traditional values like religion, family, and a strong sense of community.
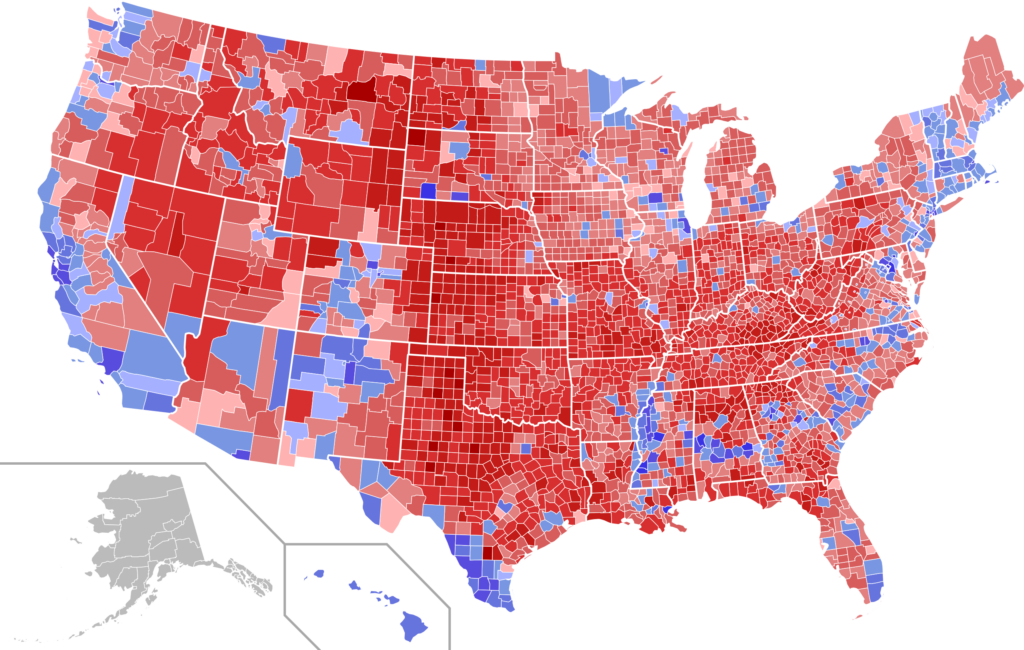
When we compare the population density map to the 2016 Presidential Election map with a local (county) scale of analysis, we can immediately see patterns. Rural areas tend to vote conservative (red), and urban areas tend to vote liberal (blue). The rural-urban divide now overlaps with the political division between conservatives and liberals.
Political scientists like Nicholas Jacobs, a professor at Colby College in Maine, describe widespread resentment among rural Americans toward urban Americans. In his book The Rural Voter, Jacobs explains that rural Americans see the newly paved roads and highways, universities, and vast economic opportunities available to urban dwellers and compare them to their crumbling infrastructure and disappearing jobs over the last 20+ years. Many rural residents, he says, feel left behind, angry, and look toward an urban population of Americans that hold vastly different values.
There is much more to be said here, which might spur some classroom discussion, but this illustrates the power of the human geography worldview. Something as simple as population density can be used to understand the economic development of different countries and the sustainability of our global population over the next 100 years. It also illuminates what’s driving the deep and sometimes violent political division ripping our country apart.