Types of Polls:
opinion
benchmark
tracking
entrance/exit
Polling Methods/Techniques
mass survey
focus group
Need to Know:
representative sample
random
sampling error
neutral wording/bias wording error
bandwagon effect
social desirability bias
non-response bias
unreliable polling influencing public opinion
Mining the views of Americans has become a keen interest of political scientists and a major industry in this age of data. Candidates running for office want to know their chances of winning and which groups support them. Once elected, members of Congress want to know how their constituents regard proposed bills and how they view different types of government spending. These elected officials and their staff members monitor public opinion by reading constituents’ letters and emails, holding town hall meetings, and reviewing surveys that are conducted in their states or districts. News organizations rely on, and even sponsor, polls to see where the public stands on important issues and political candidates.
Measures
Done scientifically, polling is the most reliable way to assess public opinion. It entails posing well-developed, objective questions to a small, random group of people to find out what a larger group thinks. Public opinion polling now follows a sophisticated methodology.
Scientific polling began in the mid-1930s, and since the Gallup Poll correctly predicted the re-election of President Franklin Delano Roosevelt in 1936, measuring Americans’ views has become increasingly sophisticated and popular. Many universities have established polling centers and major television networks and large newspapers have created their own polling departments.
Types of Polls
Pollsters use different kinds of public opinion polls to gauge attitudes on issues or support for candidates in an election in a cross-section of the population. Benchmark polls are often the first type of poll used by a political campaign, often before a potential candidate has declared his or her intentions. Benchmark polls are used to measure support for a candidate and to gather information about the issues that people care about. Tracking polls ask people questions to measure how prospective voters feel about an issue and how they may vote on election day. Tracking polls used during the course of an election allow a campaign to “track” issues and how a candidate is faring with voters. This kind of information helps candidates make decisions for shaping the campaign, particularly in the final weeks and days of the election.
Entrance polls and exit polls are conducted outside polling places on election day to publicly predict the outcome of the election after the polls close. Polling services and the news media use these polls in national and statewide elections to help them offer predictions as well as to gain insight into the thoughts and behaviors of voters or to identify and analyze how different demographics actually voted.
Presidential Approval
Polls regularly ask about presidential approval. Approval ratings are gauged by pollsters asking whether the respondent approves, yes or no, of the president’s job performance. Presidents usually begin their term with a fairly high approval as the people, Congress, and the news media get to know them during the so-called “honeymoon period.” Presidential “honeymoons” generally last a few months and are characterized by some degree of bipartisanship in Congress and generally positive coverage by the news media. Approval ratings usually reflect this time of good feeling and predictably these ratings will begin to decline as a president begins staking out positions on issues.
According to Gallup, presidents after Harry Truman average 45 to 49 percent approval over their term of office. Some of the highest presidential approval ratings have come when the nation prospered economically or when the country found itself in an international crisis and rallied around the president. The two highest recorded presidential approval ratings came after al-Qaeda attacked the United States in September 2001, when President George W. Bush scored 90 percent approval, and when his father, President George H. W. Bush, received 89 percent approval after leading a military coalition to oust Iraqi dictator Saddam Hussein from Kuwait in 1991.
However, approval ratings change, sometimes dramatically. The approval rating of President George H.W. Bush dipped to 29 percent amid high unemployment and racial discord just one year after record highs. The approval of his son, George W. Bush also dropped significantly to below 30 percent, following what many believed was an ineffective response to Hurricane Katrina and skyrocketing gas prices by the end of his second term.
Of the 12 chief executives following President Truman, six averaged an approval rating of about 47 percent and six averaged about 60 percent.
According to RealClear Politics, President Donald Trump’s job approval average at the end of his first full year was 39 percent and rising to his highest rating of 49 percent in January 2020.
Poll respondents are also often asked: “Is the nation on the right track or wrong track?” That question is commonly asked to determine Americans’ satisfaction with the perceived success of the nation. A positive “right-track” response generally means incumbent presidents will fare well in their re-election campaigns, while a high “wrong-track” response will make incumbents uncomfortable at election time. The generic party ballot simply asks respondents if they will vote for Republicans or Democrats during an upcoming election without mentioning candidates’ names. Analyzing responses to these questions together serves as a relative measure of citizen support for each party.
Focus Groups
A small group of citizens—10 to 40 people—who are gathered to hold conversations about issues or candidates form a focus group. Though less scientific than many types of polls, focus groups allow for deeper insight into a topic. Pollsters can ask follow-up questions and examine body language and intensity that would be missed in a simple automated questionnaire over the phone. For example, Republican presidential candidate Mitt Romney began wearing jeans more often when campaigning in the 2012 election after focus groups responded more positively to him in jeans than in formal clothes.
Methodology
Reliable pollsters take great pains to ensure their measurements are legitimate. They do so by constructing questionnaires with properly worded and appropriately ordered questions and selecting a representative sample from which to analyze the data and draw the appropriate conclusions.
Questions
Pollsters phrase survey questions to avoid skewing the results. The wording should be objective and not emotionally charged. Poll results on such emotional issues as abortion, same-sex marriage, and affirmative action can be distorted depending on the wording. On foreign aid, imagine how the following two questions would bring noticeably different results: “Should the United States provide foreign aid to other nations?” and “Should the U.S. give foreign aid to other nations if such a decision would lead to higher taxes in this country?” Question order can also affect the results. In a 2002 poll on President George W. Bush’s performance, for example, researchers asked the same questions but in a different sequence to two different groups. When people were asked first about the performance of the president and then the direction of the country, the president fared better. If respondents were asked about the state of the country first, which many said was bad, then the president’s approval dropped 6 percent.
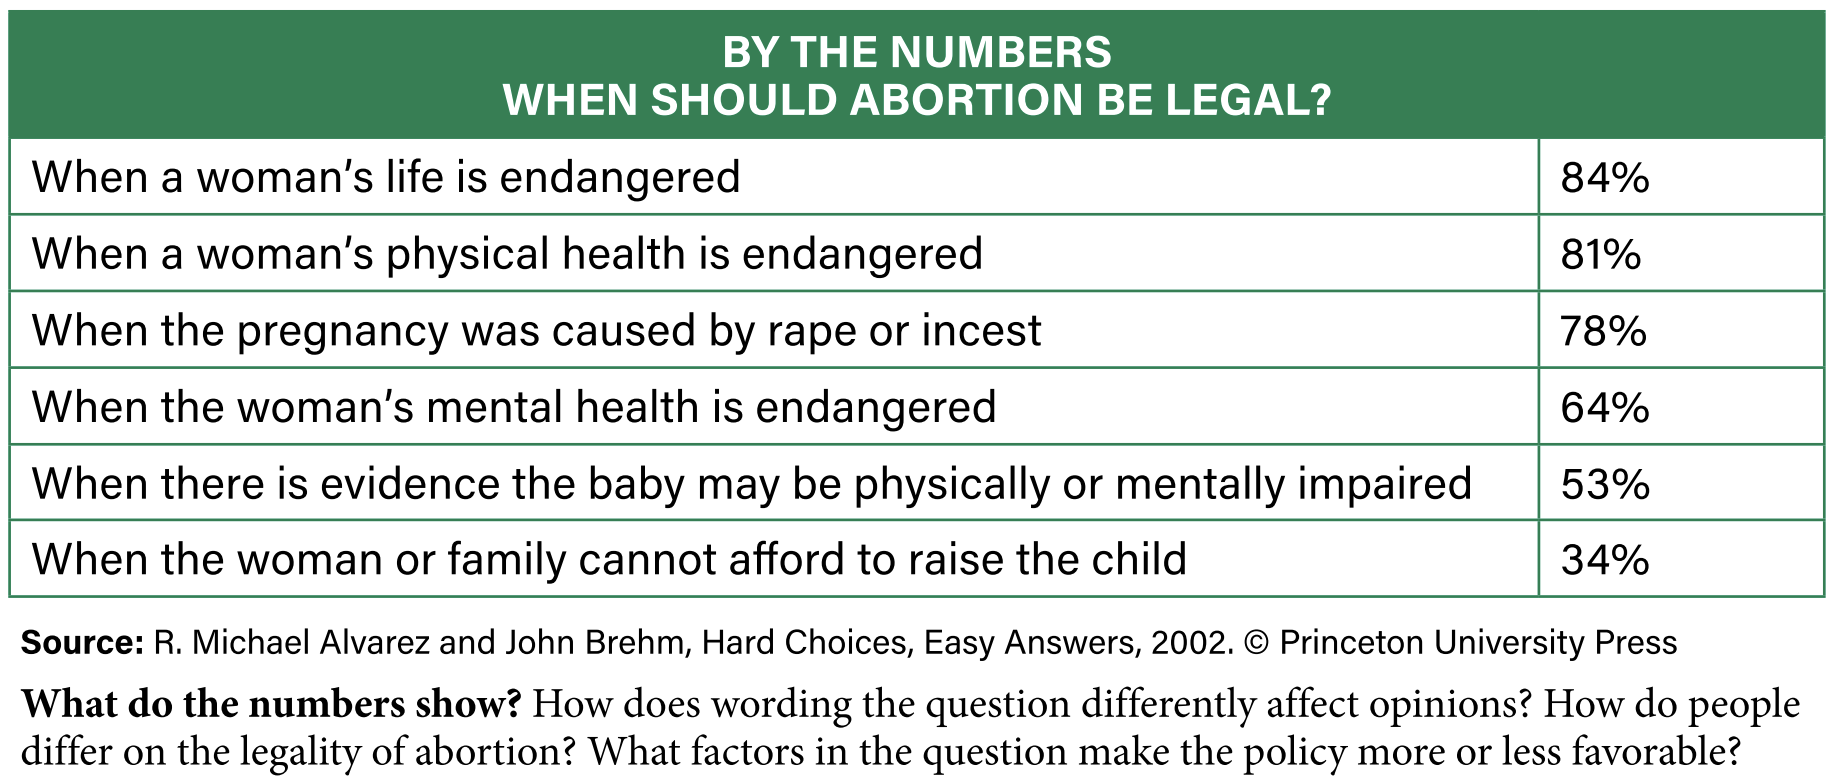
How a question is framed also affects responses. Framing a question means posing it in a way that emphasizes a certain perspective. For example, researchers found that respondents had widely varying views on whether abortion should be legal depending on how the question was framed.
Only 28 percent of Americans believe abortion should be legal under all circumstances, while many more supported abortion when the question was framed with a certain condition emphasized, as the chart below shows.
Sampling Techniques
Which people are polled is just as important as the question’s nature and wording. Proper sampling techniques assure an accurate poll with a random and fair representation of the population. The pollster takes a representative sample, a group of people meant to represent the large group in question, known as the universe. A nationally representative sample often has about 1,500 respondents, while a sample to determine public opinion within a single state would be much smaller.
Pollsters must obtain a random sample. That is, every single member of the universe must have an equal chance of selection into the sample.
A reporter or marketer standing on a street corner asking questions to passersby may determine some indication of public opinion, but this system is not random, because the person collecting the data may have biased who was included in the sample by approaching only those people who look “safe” or who otherwise look like they might be more willing to participate in the study. Since the 1980s, pollsters have used telephones as the primary contact for surveys, though there are concerns with this method. For example, roughly 30 percent of the populace has an unlisted number either by choice or because of mobility. To make telephone polling more reliable and efficient, pollsters use random-digit dialing. A computer randomly calls possible numbers in a given area until enough people respond to establish a representative sample.
Though technology has advanced, reaching voters has become more challenging. Landline use is dropping. About 95 percent of American adults own a cell phone, and a majority of homes have wireless-only phone service. More than 70 percent of all adults aged 25 to 34 years old use cell phones only and do not have landlines.
Pollsters are trying to combat this phenomenon in a few ways. One is mixing their broadly dialed, automated random phone surveys with more actual human interviewers. Federal law prohibits pre-recorded interactive surveys to cell phones. The Pew Research Center requires that 75 percent of their samples are cell phone participants.
Once the pollster has enough respondents, he or she checks to see if the demographics in the sample are reflective of those of the universe. If disproportionately more women than men answer the phone and take the poll, the pollster will remove some female respondents from the sample in order to make it proportional. If a congressional district contains roughly 25 percent African Americans, the sample needs to mirror that.
Manipulating the sample to compensate for this is known as weighting or stratification-making sure demographic groups are properly represented in a sample.
Sampling Error
Even the most cautious survey with appropriate sampling techniques cannot guarantee absolute precision. The only way to know what everyone thinks is to ask everyone and assure they are entirely honest, both of which are impossible.
Every poll has a sampling error, the difference between poll results, also called margin of error. The sample size and the margin of error have an inverse relationship. That is, as the sample gets larger, the margin of error decreases.
The way to determine this sampling error is to measure the results in two or more polls. For example, the same basic poll with two similar samples revealed that 55 percent of the first sample opposed a particular congressional bill, while 58 percent of the second sample opposed the law. This poll has a sampling error of 3 percent. A margin of error of plus-or-minus 4 percent or less is usually considered satisfactory.
Non-Attitudes
The simplest yet most perplexing problem in public opinion polling is the presence of non-attitudes. Many people do not have strong opinions on the issues of the day, or they are uninformed or simply concerned about their privacy and do not want to share their views. Just over half of eligible voters actually cast votes in presidential elections. Matters of extreme importance to journalists and policymakers may be unimportant to average citizens, so while poll results measure the views of average citizens on these matters, they don’t show the relative importance of the matters to citizens.
In a similar way, matters important to citizens may not be of interest to journalists, so polls may not reflect what is really on the minds of voters.
Another phenomenon affecting poll results is the high frequency of uninformed citizens responding. Political scientist Herb Asher explains a poll asking about the repeal of the Public Affairs Act. In reality, no such act or repeal effort existed, but fully 43 percent of those questioned had an opinion of the nonexistent law. Pollsters often ask screening questions to establish a respondent’s knowledge or to ensure they are registered voters, such as “Do you plan to vote in the November election?” Such a question, however, does not eliminate the problem entirely. In fact, more than 90 percent of people answering phone surveys claim they will vote while far fewer do. Discerning pollsters may even ask if the respondent knows the day of the upcoming election as a way to increase the chances that the respondent is a bona fide voter.
Human Bias
How the interviewer contacts and interacts with the respondent and the respondent’s views can also impact a poll. The difference between mailed questionnaires and telephone interviews is stark. People are more honest with the anonymity of a paper questionnaire than a live telephone call. Some studies show women and men answer differently to male or female callers. A woman’s right to choose an abortion was supported by 84 percent of women when interviewed by females, while only 64 percent gave a pro-choice response to a male caller. Race, or perceived race, can matter as well.
Asher claims that African Americans are more critical of the political and criminal justice system to black interviewers while more supportive to white interviewers. White respondents are less likely to reveal attitudes of racial hostility when interviewed by African Americans than by whites.
Still other problems exist because not everyone conducting a poll represents an objective journalist or an academic. Fundraising under the guise of polling has cheapened polling’s reputation. Political parties and candidates use phone and mail surveys to assess where their followers stand and then ask for a donation.
Also, push polling is a controversial and deceptive way to influence potential voters. Push polls are done via the telephone and rather than a series of neutral questions meant to determine public opinion on a candidate, the caller, or more commonly a tape-recorded voice, offers positive points about the candidate or negative points about the opponent. These attempts to “push” certain views on people aren’t actually polls but a form of political campaigning.
Internet polling can be problematic because there is no way to assure a random sample. When directed toward an Internet poll, only those strongly motivated will participate. Some online polls allow respondents to complete the questions as many times as they like. Internet users also tend to be younger, better educated, more affluent, white, and suburban than those offline more often and do not represent a genuine cross section of society.
Evaluating Public Opinion Data
What the public thinks and how that thinking is conveyed to government officials are factors in shaping public policies. Professionals try to measure public opinion for a variety of reasons, using methods that make the results as accurate as possible. Analysts and citizens alike should consider the legitimacy of a poll as much as its general findings, because if its method is faulty, its findings will be as well.
Claims, Credibility, and Public Opinion Data
As participants in democracy either at or approaching voting age, you will be surrounded by public opinion polls and claims based on them. Knowing how to evaluate the quality and credibility of those claims will help you make informed decisions.
Public Opinion and Political Influence
Polls lend themselves to “horse race” news coverage in which elections are reported as if the most important aspect is which candidate is in the lead. Critics of “horse race” journalism argue voters need more substance, such as how a candidate views major issues that affect social policy or government spending.
This kind of media coverage can translate into significant political influence as well. National polling influences whose voice will be heard at the televised debate and whose would be silenced. For example, early in the Republican primary season in 2016, the first debate among the party’s candidates was being planned with 17 candidates vying for the nomination. How could a reasonable debate be carried out with so many people on stage? The host of the debate, Fox News, made a decision to limit the number of participants to 10. Fox would choose from the 17 candidates those who registered in the top spots from an average of five national polls as the debate grew near. If anyone in the top ten failed to earn at least a 5 percent ranking in the polls, that person would be eliminated from the debate. In such debates, candidates with higher poll numbers are stationed toward the middle of the stage allowing them to appear on the screen more frequently and say more.
National polling also exerts influence on elections through the bandwagon effect – a shift of support to a candidate or position holding the lead in public opinion polls and therefore believed to be endorsed by many people. The more popular a candidate or position, the more likely increasing numbers of people will “hop on the bandwagon” and add their support. People like to back a winning candidate. For this reason, most media outlets do not report the findings from their statewide Election Day exit polls until polls have closed in that state. If people who have not yet voted learn that Candidate A is way ahead in votes, they may not bother going to the polls, because they support either Candidate A (that candidate will win anyway) or a rival who was behind (that candidate has no chance of winning).
The bandwagon effect is also partly responsible for the direct link between a candidate’s rank in national polls and the ability to raise campaign funds. The higher the national ratings, the more campaign contributions a candidate can elicit. The larger a candidate’s war chest – the funds used to pay for a campaign – the more ads a candidate can buy and the larger the staff a candidate can maintain. Both greatly influence the outcome of an election.
Influence on Policy Debate
Scientific polling also exerts an influence on government policy and decision-making, although its effects are less clear than on elections. The three branches of the government tend to respond to public opinion polling in somewhat different ways, if at all.
The legislative branch is sometimes responsive to public opinion polls, especially the House of Representatives where lawmakers face reelection every two years. Many try to represent their constituencies and to keep them satisfied with their performance to encourage fundraising and subsequent votes, so knowing constituent views pays off. Senators, with longer terms, do not seem as sensitive to pressure from public opinion.
The executive branch has sometimes been influenced by public opinion and at other times has tried to use the power of the “bully pulpit” to shift public opinion. A president usually enjoys high approval ratings in the first year of office and tries to use that popularity as a “mandate” to advance his or her agenda as quickly as possible.
The judicial branch may be influenced by the general mood of the nation. Different studies have drawn varying conclusions about why. However, many have concluded that when the opinions of the nation shift toward liberal, the Court will hand down more liberal rulings. This was apparent with the growing liberal attitudes of the 1960s and the often-liberal decisions handed down by the Warren Court. Conversely, when the nation moved toward conservative ideology near the end of the 20th century, the Rehnquist Court’s rulings often mirrored those beliefs.
However, federal judges are appointed for life and are not at the mercy of the ballot box, keeping the judicial branch somewhat removed from the sway of public opinion.
Reliability and Veracity of Public Opinion Data
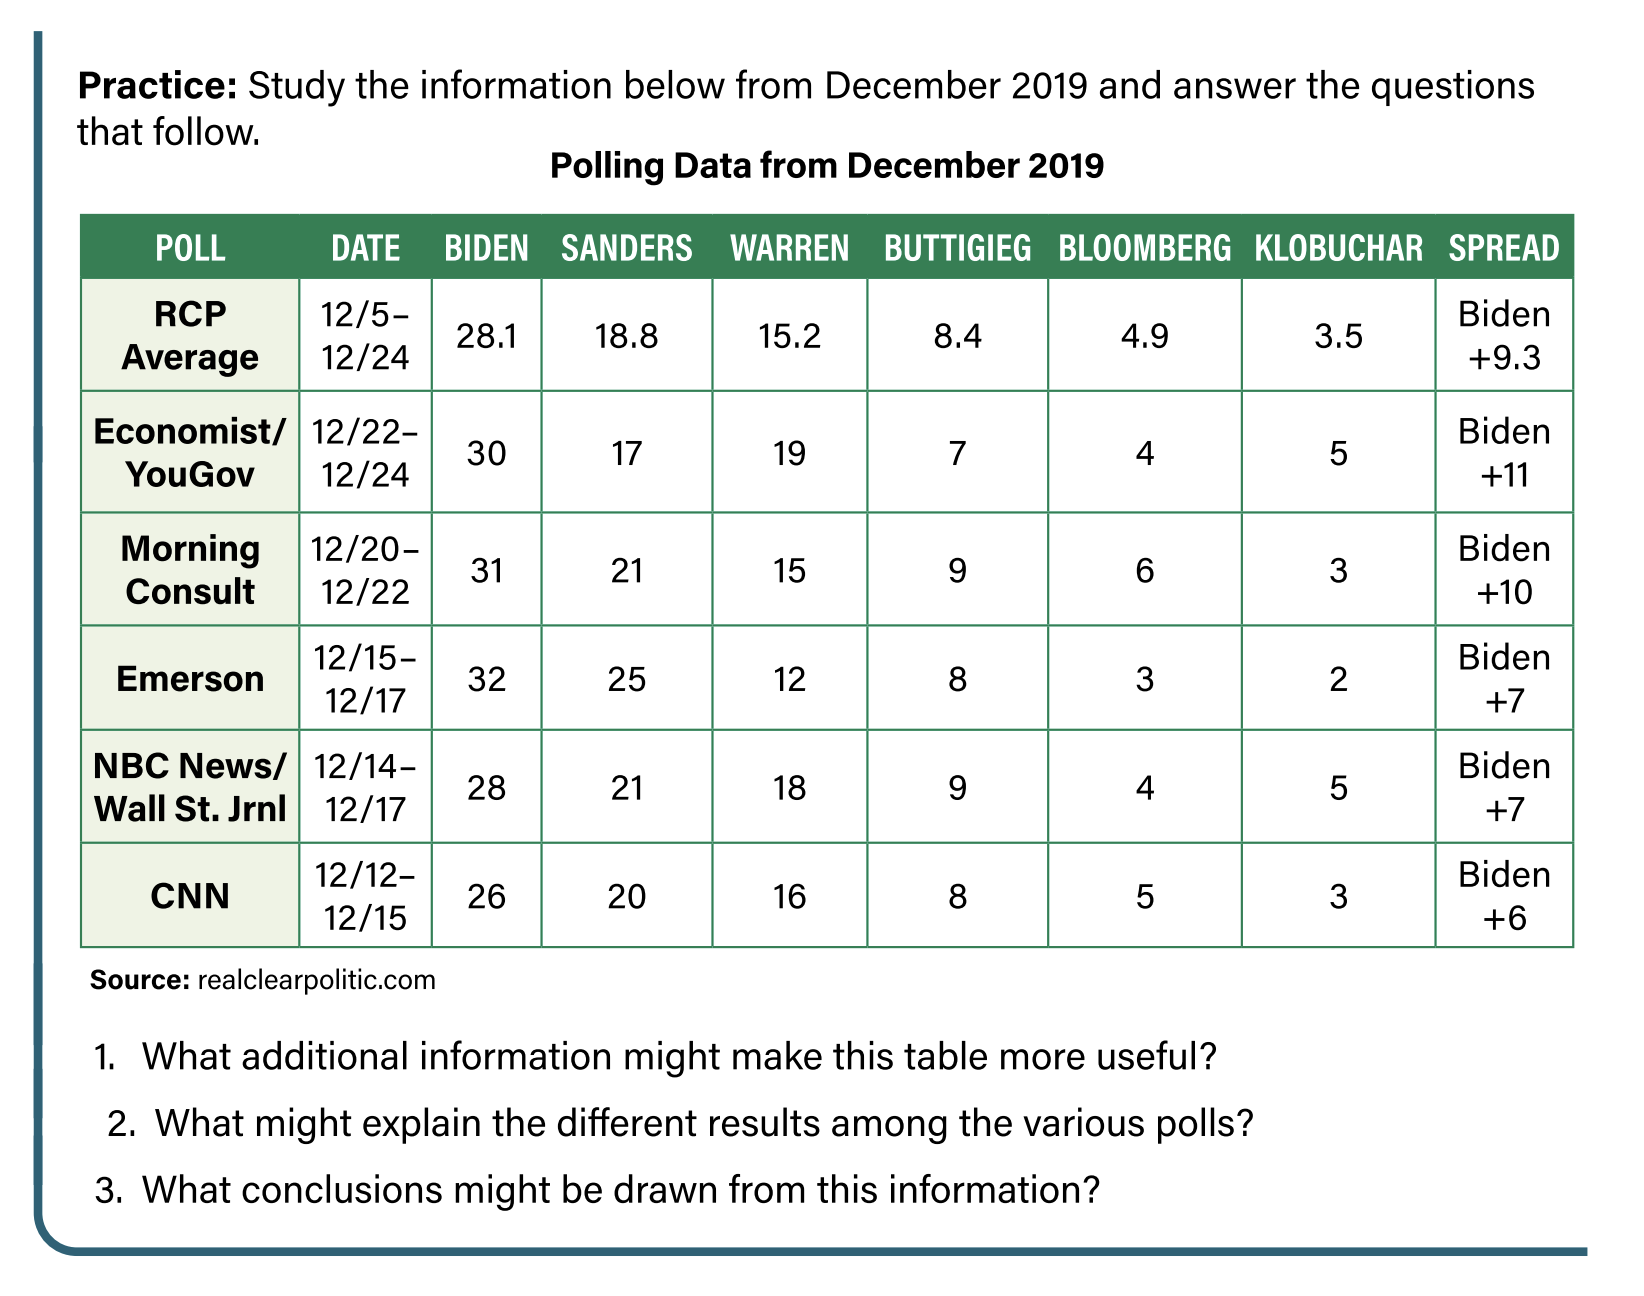
One way to gauge the accuracy of a pre-election poll is to measure “candidate error”-the percentage point difference in the poll’s estimate and the candidate’s actual share of the vote after the election. Candidate error has gradually declined as polling techniques have become more sophisticated. But in the last few years, what has been a consistently improving science and practice, with the occasional setback, has had some less-than-accurate predictions.
For example, Gallup predicted Mitt Romney as the winner of the 2012 presidential election with 50 percent of the vote and President Obama at 49 percent. In reality, Obama won nationally by nearly four points. This failure led to Gallup’s eventual decision to no longer predict presidential election outcomes through the so-called horse-race polls, but to stick instead to its vast polling of issues and views in other areas of public policy. Gallup wasn’t the only firm that had an erroneous prediction outside the margin of error in 2012.
In the waning days of the 2016 presidential election, national polls projected that Hillary Clinton would defeat Donald Trump. Election forecasters, those who aggregate polls and other data to make bold predictions, put Clinton’s chances of winning at 70 to 99 percent. The final round of polling by most major firms had Clinton winning by anywhere from 1 to 7 percentage points in the national vote. However, the election was ultimately decided by 51 state elections (counting the electoral votes from Washington, DC). On the day prior to the election, 26 states had polling results with Trump ahead. His strongest support was in Oklahoma and West Virginia where 60 percent of respondents claimed a vote for Trump. 23 states had Clinton ahead. Maryland and Hawaii showed the strongest support for Clinton with 63 percent and 58 percent respectively. Once the vote was counted, Clinton won the popular vote by 2 percentage points but lost the Electoral College vote.
Several factors may explain why polls may be inaccurate and unreliable. One factor relates to the psychology of the respondents. Another factor relates to undecided voters and when they finally make up their minds.
Social-Desirability Bias
The psychology behind the errors in recent polls is at least in part explained by social desirability bias -the tendency for respondents and declared voters to tell pollsters what they think the pollsters want to hear. Social desirability bias affects the predictions of voter turnout. Respondents may give the interviewer the impression that they will indeed vote, because they do not want to be seen as shirking a responsibility, but often on Election Day they do not vote. In a recent estimate, when asked their likelihood of voting on a scale of 1 to 9, U. S. citizens tended to say 8 or 9, yet only about 60 percent of eligible voters cast ballots.
Social desirability bias can fool pollsters on matters beyond inflated turnout.
Voters do not want to be perceived negatively, so they may give the interviewers a socially acceptable response, or what they perceive as the acceptable response, and yet act or vote in a different way. This phenomenon was noticeable in the 1982 California governor’s race. The election included a popular candidate, Los Angeles Mayor Tom Bradley, who would have been the state’s first African American governor. Bradley led by a clear margin in the polls throughout the campaign but lost on Election Day. Most experts attributed the discrepancy to interviewees’ falsely claiming they supported Bradley only later to vote for a white candidate. These poll participants did not want to appear bigoted or against the African American candidate. In what has become known as the Bradley effect, recent African American candidates have also underperformed against their consistently inflated poll predictions.
Pundits in 2017 encouraged speculation as public opinion polls shifted in the special U.S. Senate election in Alabama. In some polls, Republican candidate Roy Moore, the favorite for weeks, was suddenly losing to Democrat Doug Jones after Moore was alleged to have committed sexual assault or aggressions toward several women when they were teenagers. Skeptics of the new polls pointed out that voters might not willingly admit on the phone that they were going to vote for this accused candidate. In fact, one famous political pundit, Nate Silver, pointed out that in polls using robocalls, or automated prerecorded polls, Moore was ahead, and in polls using live interviews, Jones was ahead. Jones won in a close contest.
Undecideds Breaking Late
According to exit polling and research after the election, a likely explanation for Trump’s surprise win was that a larger than usual share of undecided voters “broke”-made their final decision late-for Trump. Nate Cohn of The New York Times explains how likely voters who said they were voting for a third-party candidate mostly did so. But 26 percent of those voters turned to Trump and only 11 percent switched to Clinton. Pollsters theorize that a disproportionate number of so-called “shy Trump voters” simply declined to participate in any polling opportunities. Perhaps the same anti-establishment, anti-media attitude that drew these voters to the outsider candidate also turned them away from pollsters, a phenomenon known as non-response bias.
Opinions in Social Media
The willingness of people to take part in polls is declining. About 37 percent of randomly called citizens would participate in a telephone poll in 1997.
Today, pollsters get about a 10 percent response rate with live callers, and about 1 percent participation with robocalls. However, as Kristin Soltis Anderson, author of The Selfie Vote, points out, “The good news is, at the same time people are less likely to pick up the phone and tell you what they think, we are more able to capture the opinions and behaviors that people give off passively.” Pollsters can take the public’s pulse from available platforms widely used by a large swath of the general public. Examining what is said on social media and in the Google toolbar can tell us a lot about public opinion.
Though blogs and the Twitter-verse constitute a massive sample, the people active on social media may have very different views from those who are not active on social media, so the sample is not representative. A 2015 study found that people who discuss politics on Twitter tend to be overwhelmingly male, urban, and extreme in their ideological views. Another problem that makes this endeavor less than reliable is that researchers use computer programs to gauge the Internet’s dialogue but cannot easily discern sarcasm and unique language. And overly vocal people can go onto the Internet repeatedly and be tabulated multiple times, dominating the conversation disproportionately.
Biased Pollsters and Data vs. Fact
Reputable pollsters seek ways to avoid bias in sampling techniques and the wording of their questions. However, many polls are funded by political parties and special interest groups who want the poll results to tip a certain way.
Interest groups will use those results to move their agendas forward, claiming that the data generated by their polls represent fact. “The numbers don’t lie,” they might say. Parties may use information to convince the public that their candidate is popular and doing well among all voters or various blocs of voters.
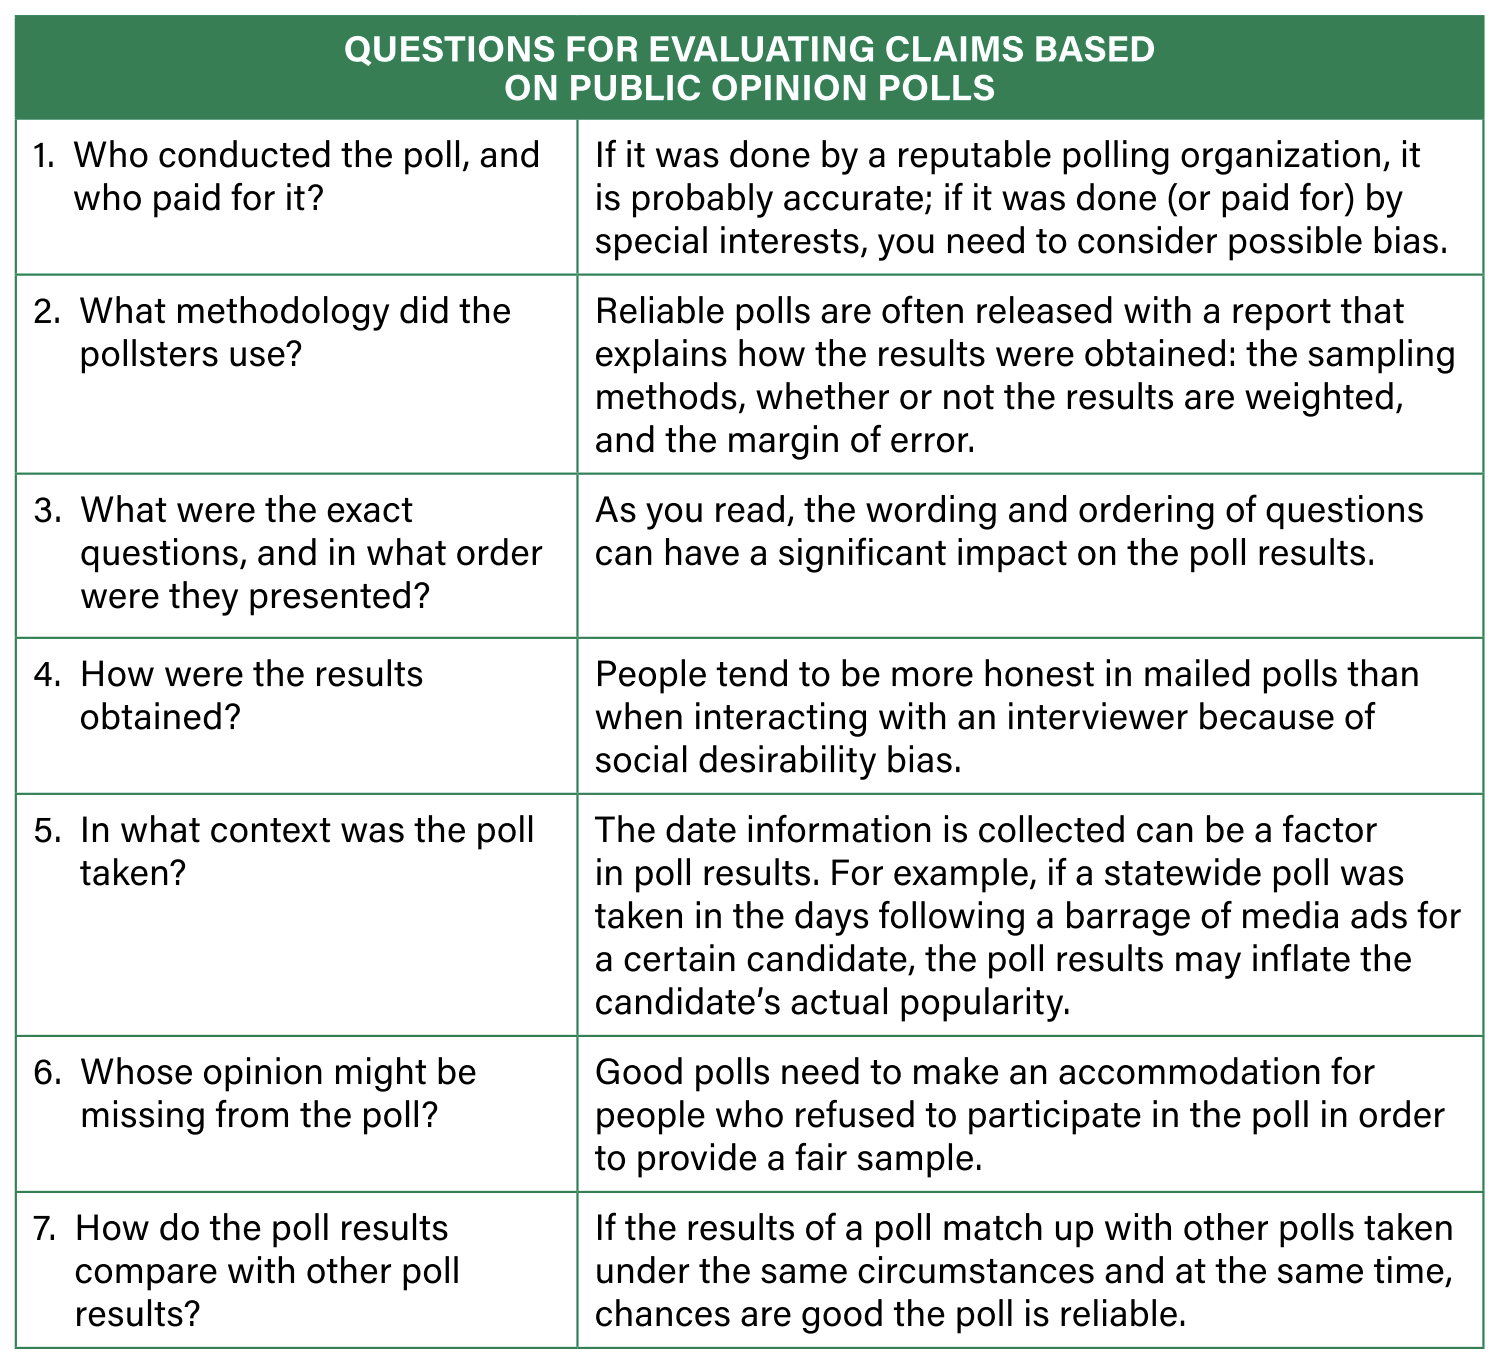
Unless you know about the organization doing the polling, the methods it used, the wording of the questions, and the context of the poll, you will not be able to evaluate a poll’s veracity, or truthfulness. You have already read about how push polls slant their questions to produce certain outcomes. Political Action Committees (PACs), special interest groups, and partisan organizations all have a vested interest in getting a response from a poll that supports their cause. To help journalists evaluate the reliability and veracity of polls, the National Council on Public Polls (NCPP) provides 20 questions journalists should ask and answer before reporting on a poll. You can find that list on the NCPP website. The checklist below provides some of the key questions to ask about any poll.